Transform your presentations with our dynamic Design PowerPoint diagram templates. Perfect for marketers educators and analysts these templates convert complex data into clear visually appealing graphics.
Intuitive shapes color-coded segments and scalable vectors make it easy to maintain clarity and professional polish. From flowcharts to Venn diagrams every template is ready to customize and animate for maximum impact.
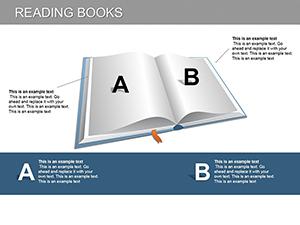
Infographic Reading Books PowerPoint Diagrams: Storytell with Visuals
ID: #PD00119
$24.00
(820)
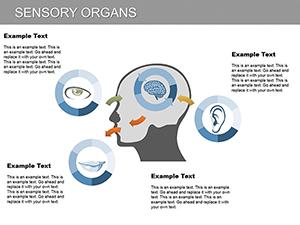
Sensory Organs PowerPoint Diagram Template
ID: #PD00115
$23.00
(71)
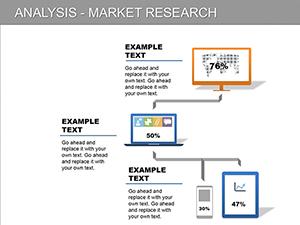
Strategic Market Analysis PowerPoint Diagrams: Drive Business Growth
ID: #PD00110
$15.00
(818)
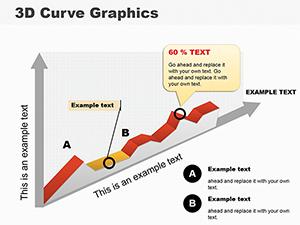
3D Curve Graphics PowerPoint Template: Dynamic Diagrams
ID: #PD00105
$12.00
(435)
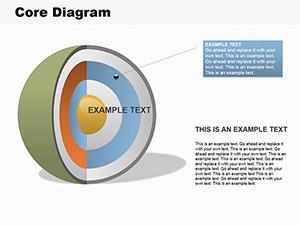
Core Spherical PowerPoint diagrams
ID: #PD00104
$28.00
(982)
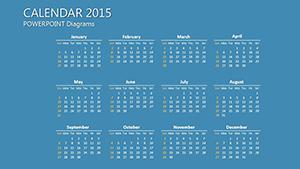
Editable 3D Graphics Keynote Template
ID: #PD00102
$15.00
(450)
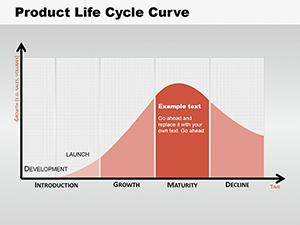
Product Life Cycle Curve PowerPoint Diagrams: Chart Your Success
ID: #PD00101
$12.00
(943)
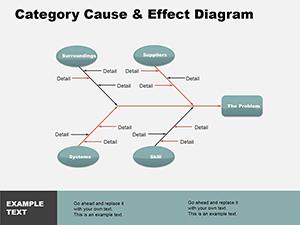
Cause Effect PowerPoint Diagrams: Decode Impacts with Precision
ID: #PD00082
$14.00
Maximize Communication with Design Diagram Templates
Design-focused PowerPoint diagrams are ideal for illustrating processes hierarchies and relationships in business education and marketing presentations. Save time and improve clarity with templates built for rapid editing and customization.
These templates surpass default PowerPoint diagrams by offering pre-built layouts consistent color schemes and animation-ready elements. They enhance audience engagement and convey information more effectively.
Practical Applications
Business Reports: Visualize workflows and organizational charts
Marketing Presentations: Segment audiences and display campaign results
Education & Training: Map learning paths and course content
Project Management: Track tasks milestones and dependencies
Benefits vs Standard Templates
Editable and fully customizable
Professional designs ready for client presentations
Time-saving prebuilt diagrams
Enhanced clarity and engagement
Tips for Effective Diagram Design
Use consistent colors to highlight relationships
Keep layouts clean and uncluttered
Label every element for clarity
Test legibility in full-screen mode
Download and elevate your presentations with our editable design diagrams today.
Frequently Asked Questions
Are these templates editable in Google Slides?
Yes you can edit core elements in Google Slides with minor adjustments.
Can I animate the diagrams?
Yes animations can be applied to highlight steps and relationships.
How many templates are included?
Over 50+ editable design diagram templates are available.
Are these suitable for marketing presentations?
Yes they are ideal for illustrating campaigns and audience segmentation.