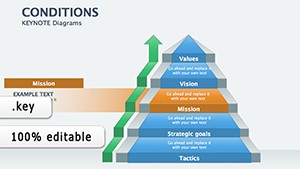
Keynote diagram templates are your shortcut to visualizing processes, hierarchies, and connections with Apple`s signature polish. Perfect for consultants mapping strategies, teams outlining projects, or instructors breaking down theories, these tools turn abstract ideas into concrete visuals.
Our library spans flowcharts, Venn diagrams, and organizational charts, all optimized for Keynote`s fluid animations and high-res exports. Key advantages: effortless scalability, theme harmony, and quick edits that let you iterate on the fly.
Aimed at users who prioritize clarity and creativity, they help distill complexity into digestible formats. Envision a product roadmap unfolding slide by slide or a lesson plan branching like a mind map - engaging and intuitive.
These templates boost comprehension rates, making them indispensable for collaborative environments. Plus, they`re device-agnostic within the Apple ecosystem for uninterrupted workflow.
Peruse the Keynote diagrams category and select templates that amplify your voice.
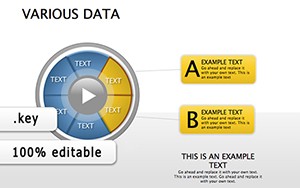
Default diagrams in Keynote can be rigid and uninspired; our versions introduce modular components for endless reconfiguration. They support layered builds, revealing information progressively to maintain interest. Professionals note reduced revision cycles, as alignments and proportions are pre-perfected.
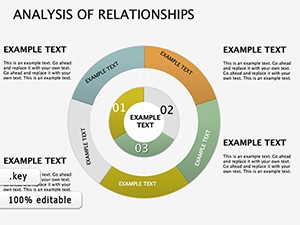
In consulting, swimlane diagrams delineate responsibilities; education favors concept maps for interconnections. Design firms use radial layouts for brainstorming sessions that spark innovation.
Outshining basic shapes, these include icon libraries and color gradients for depth. Best tip: Use connectors that auto-adjust for dynamic changes, ensuring polish under pressure.
Begin with audience analysis - what level of detail do they need? Our templates accommodate by offering simplified and detailed variants. Integrate text sparingly; let lines and nodes speak volumes.
For inclusivity, add screen-reader friendly labels. A tech lead, for example, utilized our process flow template to onboard new hires, cutting training time by half through visual clarity.
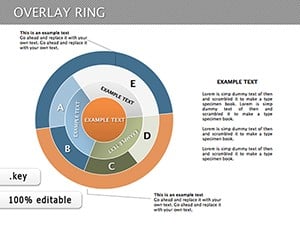
In another scenario, a novelist workshopped plot structures with branching diagrams, fostering deeper critiques. Layer transparency for overlaps, creating a sense of interconnectedness without chaos.
Link diagrams to hyperlinks for interactive decks. Grab your ideal diagram template and streamline your storytelling today.
These diagrams are your canvas for clarity. Delve into the collection and craft narratives that stick.
Copyright © 2009-2026 ImagineLayout All rights reserved.