Bring continuity to your narratives with our curated cycle diagram templates tailored for PowerPoint. These versatile designs excel at portraying repeating sequences, such as operational loops or innovation cycles, turning static slides into flowing stories.
Suited for executives, trainers, and marketers, the templates boast precise vector graphics and theme-compatible colors. Simplify intricate concepts like budget cycles or team rotations, ensuring your message resonates deeply.
Fully editable with drag-and-drop simplicity, integrate charts or images effortlessly. Focus on content while our designs handle the polish. Peruse our assortment and select cycles that align with your vision.
Let`s loop in some excellence. Grab your template now and streamline your slide creation.
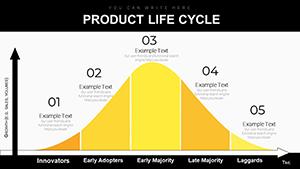

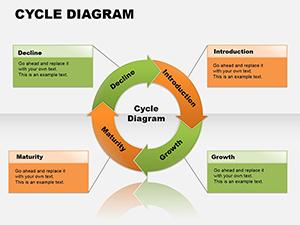

Cycle diagrams in PowerPoint master the art of endless progression, linking steps in a seamless circle that underscores interdependence. With morph transitions, they animate fluidly, revealing layers that captivate without distraction.
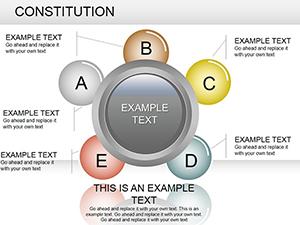
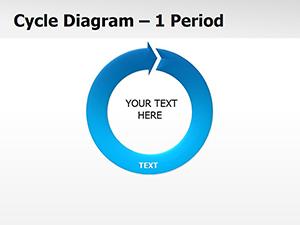
Distinguished from sequential lists by their circular logic, they suit endless endeavors like quality control or seasonal campaigns. Our offerings feature modular segments for effortless reconfiguration.
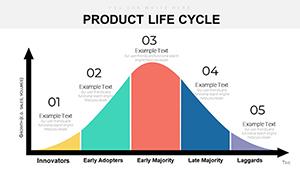
Default PowerPoint cycles lack flair; ours add textured fills and shadow depths for a premium feel that commands attention.
Corporate trainers deploy them for skill development loops, from assessment to application. Non-profits visualize impact cycles, tracing donations to community outcomes in empathetic arcs.
Instructors animate historical event cycles, like election processes, with timed reveals. Artists use them for mood boards, looping inspirations in vibrant palettes.
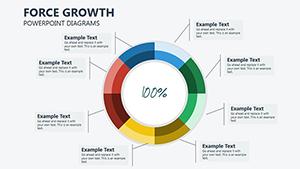
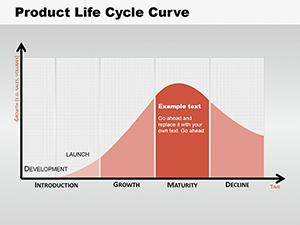
Anchor cycles with a focal point, like a metric gauge, to measure loop efficacy. Opt for sans-serif fonts for readability, and align with gridlines for precision.
Combine with callout bubbles for annotations, enriching without encumbering. Preview in slideshow mode to fine-tune pacing.
A logistics firm charts delivery cycles, with truck icons zipping along routes, quantifying efficiency gains. Healthcare decks loop patient care paths, from diagnosis to follow-up, with soothing blues.
Tech webinars feature code deployment cycles, branching into sub-loops for debugging, demystifying devops.
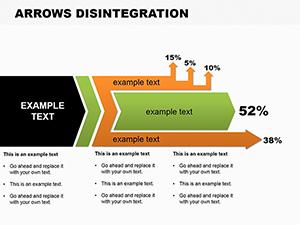
Insight: Use gradient arrows to imply momentum, energizing static data.
Demystify cycle creation with these answers.
Cycle towards clarity. Secure your template and propel your PowerPoint prowess forward!
Copyright © 2009-2026 ImagineLayout All rights reserved.