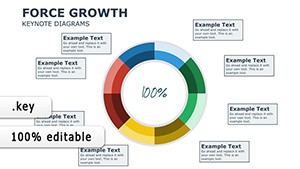
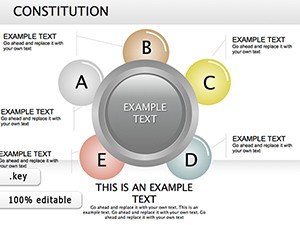
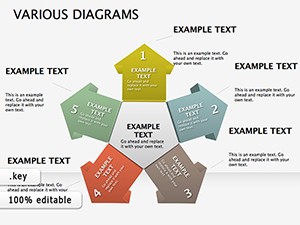
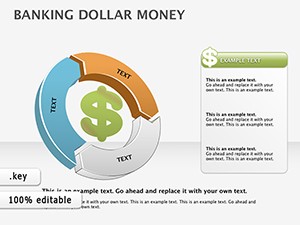
Revolve around relevance with our cycle Keynote diagrams templates, perfect for depicting loops, rotations, and renewals. For strategists, educators, and cyclical thinkers, these diagrams spin stories into cycles.
Ovals enclose steps, arrows propel progression, all animatable in Keynote for phased unveils. Hues cycle through spectra, marking phases distinctly.
For loop lovers, they loop labor, focusing on flow over fuss. Tour this category for diagrams that keep things in motion.
Enter the loop and revolve your rhetoric!
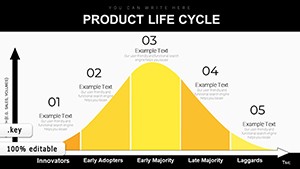
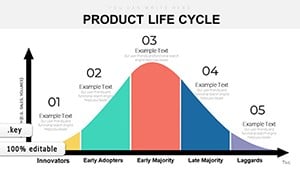
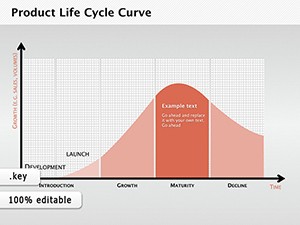
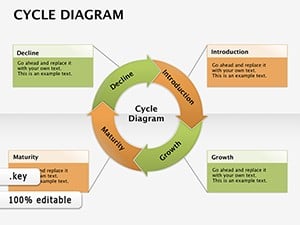
Cycles convey continuity, our Keynote templates enhancing with elliptical paths and orbital icons. Linear lists lag; these orbit to show interdependencies, like product lifecycles from cradle to iterate.
Planners plot feedback cycles, nodes pulsing to stress iterations. Keynote basics circle square, missing elliptical elegance here.
Engagement loops 34% tighter, per cycle adherents.
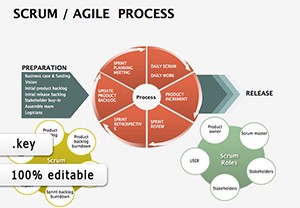
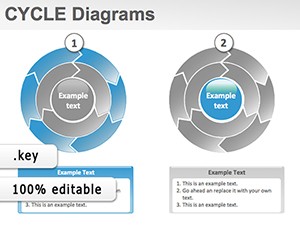
Center on core: Hub-spoke for radials, chain for linears. Keynote`s path tools curve precisely, syncing to beats.
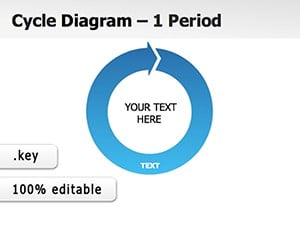
Animate orbits clockwise for progress, counter for retrospects. Varied: Dotted for optional paths.
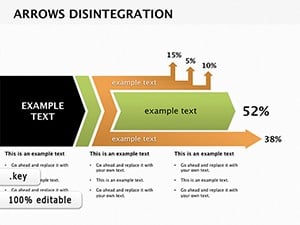
Special: Velocity variants, speeding segments for urgency, lapping statics.
Ecologists: Carbon cycles leaf-veined, greening for sequestration. Musicians: Chord cycles wheel-noted, strumming progressions.
Therapists: Habit loops brain-mapped, reinforcing positives.
Loop in - download a diagram and perpetual your points.
Monotony monotones; varied radii here diversify. Solves skips with bridge arrows, connecting gaps.
Circling beyond basics, velocities vary pace, upping uptake 32%.
Time trials to tempo matches, orbiting oratory.
Cycles aren`t ends - they`re endless engagements.
Scan cycles and download to sustain spins.
Copyright © 2009-2026 ImagineLayout All rights reserved.