Cycle phase Keynote Charts

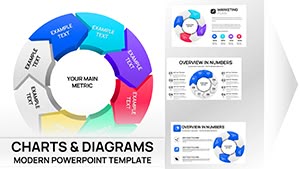
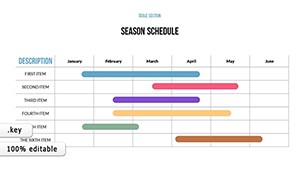
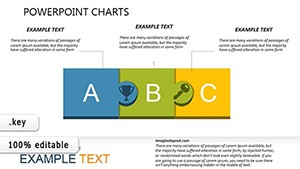
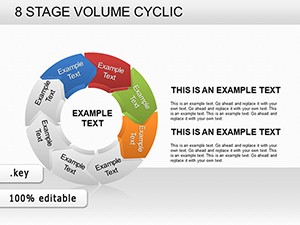
Navigate complex processes with cycle phase Keynote charts, featuring interconnected loops and phased segments that clarify every step. Designed for project managers, analysts, and strategists, these charts distill intricate workflows into digestible visuals, promoting understanding and action.

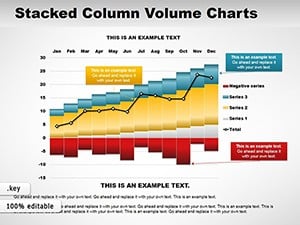
Benefits abound: from highlighting bottlenecks to forecasting outcomes, they empower data-driven decisions in business cycles or life stages. The modular phases allow tailoring to any duration, be it quarterly reviews or annual planning.

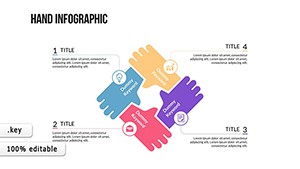
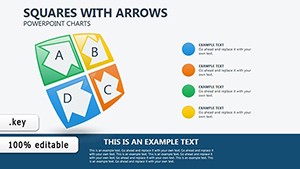
With smooth animations that cycle through stages, your audience follows effortlessly. Customize arrows, icons, and labels to reflect your unique narrative. Ideal for agile teams or continuous improvement initiatives, these charts turn abstract concepts into concrete roadmaps.

Delve into our assortment and chart a course with the perfect cycle template for your Keynote needs.


View by: Last Added | Most Popular
  • like 3
    (667)
    Rings Connection Keynote Charts for Cycle Processes
    ID: #KC00868
    $16.00
  • like 4
    (485)
    Cyclic Double Rings Keynote Charts Template
    ID: #KC00796
    $18.00
  • like 2
    (1070)
    Development Keynote Charts Template: Empower Your Presentations with Dynamic Growth Visuals
    ID: #KC00781
    $17.00
  • like 4
    (326)
    Logic of Operational Analysis Keynote Charts
    ID: #KC00603
    $17.00
  • like 4
    (1045)
    Business Development Strategies Keynote Charts: Navigate Growth with Visual Precision
    ID: #KC00587
    $20.00
  • like 3
    (893)
    Business Strategy Development Keynote Charts
    ID: #KC00577
    $19.00
  • like 5
    (165)
    Creative Thinking Keynote Charts: Where Ideas Take Flight
    ID: #KC00533
    $23.00
  • like 3
    (16)
    Business Keynote Charts Template: Architect Your Success Story
    ID: #KC00522
    $24.00
  • like 4
    (84)
    Schedule Keynote Charts Template: Organize with Precision and Style
    ID: #KC00515
    $18.00
  • like 2
    (482)
    TOP Business Keynote Charts: Editable Mastery
    ID: #KC00487
    $24.00
  • like 5
    (997)
    Creative Light Coloured Keynote Charts: Illuminating Pathways to Brilliance
    ID: #KC00475
    $18.00
  • like 2
    (73)
    Mobile Apps Keynote Charts: Chart Your Path to App Dominance
    ID: #KC00415
    $16.00
  • like 4
    (598)
    8-Stage Volume Cyclic Keynote Charts Template
    ID: #KC00230
    $23.00
  • like 3
    (281)
    Squares Arrows Keynote Charts: Charting Pathways to Project Success
    ID: #KC00199
    $18.00
  • like 5
    (842)
    Stacked Column Volume Charts for Keynote
    ID: #KC00053
    $14.00
  • like 3
    (128)
    Column Line Charts Keynote Template: Dynamic Visuals
    ID: #KC00052
    $16.00
  • like 3
    (242)
    Lines Keynote Charts Template: Visualize Trends Effortlessly
    ID: #KC00050
    $12.00
  • like 2
    (327)
    3D Pie Collection Keynote Charts Template
    ID: #KC00047
    $22.00
  • like 4
    (948)
    Pie 5 Segments Keynote Charts: Slice into Storytelling Mastery
    ID: #KC00001
    $22.00


Strategic Use Cases for Cycle Phase Keynote Charts

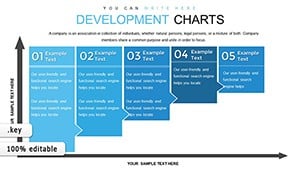
Cycle charts illuminate software development sprints, looping from ideation to deployment. In manufacturing, they track production cycles, phasing materials through assembly. HR leverages them for talent pipelines, cycling candidates from recruitment to retention.

Sustainability experts map eco-cycles, from resource use to recycling, while fitness coaches outline training phases in repeating loops.

Business and Project Management

  • Agile methodologies: Sprints as sequential cycles.
  • Budget planning: Fiscal phases in circular flow.
  • Risk assessment: Feedback loops for mitigation.

Analytical and Training Applications

Consultants visualize client engagement cycles, and trainers break down skill acquisition into iterative phases.

Advantages Over Standard Flowcharts

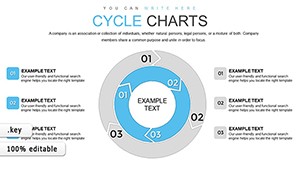
Linear flowcharts in Keynote ignore recurrence; our cycle phases embrace it with closed loops that stress continuity, reducing misinterpretation in ongoing processes. This cyclical view aligns with real-world iterations, improving strategic foresight.

Scalable segments prevent overcrowding, and color-coding phases aids quick scans. Built for collaboration, they update in real-time during group edits.

Core Strengths

  1. Phase Flexibility: Add/remove segments dynamically.
  2. Visual Hierarchy: Thicker lines for critical junctures.
  3. Data Linking: Embed spreadsheets for live updates.

Optimizing Cycle Charts in Keynote

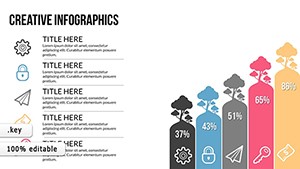
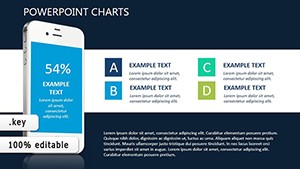
Prioritize clarity: label phases concisely and use icons for instant recognition. Animate clockwise to imply progression, pausing at decision points. Integrate metrics within segments for at-a-glance insights.

For multi-cycle decks, nest smaller loops inside larger ones. Validate with stakeholders pre-presentation to refine arrows.

Practical Illustrations

Consider a marketing funnel: awareness to conversion in a tightening spiral. Or R&D: prototyping cycles orbiting innovation hubs.

Loop into excellence - download a cycle phase chart and propel your Keynote forward.

Frequently Asked Questions

Complete the circle - browse our cycle phase Keynote charts and download to streamline your processes today.