Navigate monetary complexities with our Currency PowerPoint Chart templates, turning raw numbers into compelling stories. Tailored for economists forecasting trades, managers budgeting quarters, or investors tracking exchanges, these visuals demystify data.
From exchange rate lines to infographic maps, designs feature scalable elements for precise tweaks - update figures, recolor trends, or add annotations in moments.
For finance teams and consultants, this repository accelerates reporting, focusing energy on analysis. Scan new arrivals and hits to pinpoint your fiscal ally.
Chart your course to clarity - access these templates and illuminate insights.
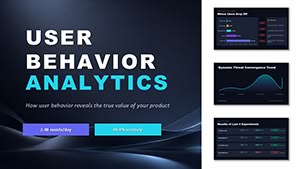
Marketing Analytics PowerPoint Charts Template: Master Data Visualization
ID: #PC00528
$24.00
(816)
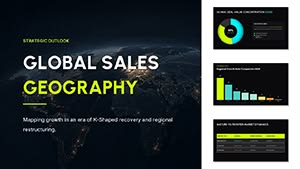
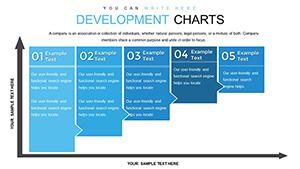
Business Presentation PowerPoint Charts Template: Modern Edge for Impact
ID: #PC00522
$24.00
(631)
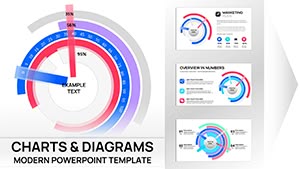
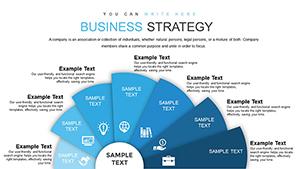
Professional Business PowerPoint Charts: Drive Decisions with Data
ID: #PC00487
$24.00
(1150)
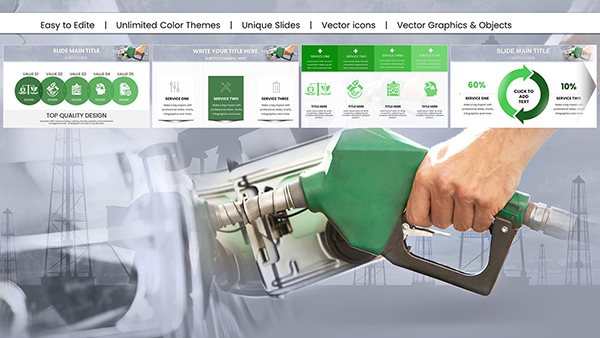
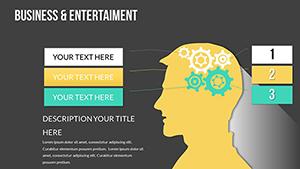
Advertising Strategies PowerPoint Charts: Craft Winning Media Plans
ID: #PC00486
$17.00
(774)
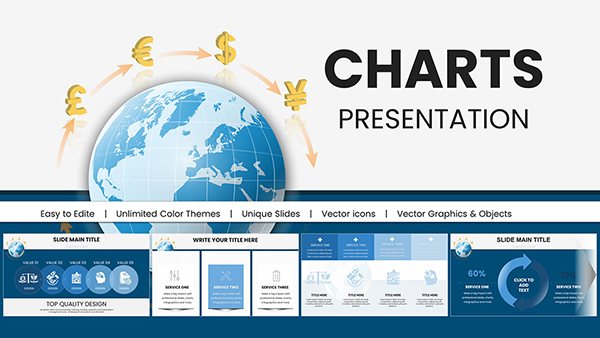
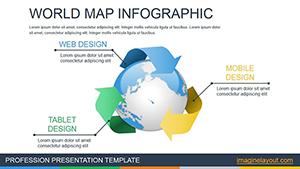
World Map Infographic PowerPoint Charts Template for Global Insights
ID: #PC00470
$16.00
Transforming Financial Narratives with Currency Charts
Picture boardrooms nodding in unison as currency fluctuations unfold via sleek lines and bars, revealing opportunities at a glance. Our Currency PowerPoint Chart templates orchestrate this by embedding dynamic visuals into robust frameworks, far beyond static spreadsheets that bury insights.
In volatile markets, timely depictions are vital; these aid in dissecting forex patterns or policy impacts with layered depth.
Core Applications in Finance and Strategy
Market Analyses: Plot exchange trends with interactive timelines.
Budget Reviews: Break down allocations using pie segments for categories.
Investment Pitches: Illustrate growth via rising trajectory graphs.
Risk Assessments: Map volatilities with scatter plots and alerts.
These implementations underscore the templates` strategic value.
Outpacing Traditional Chart Tools
Basic charts lack narrative pull; ours infuse animations that simulate value shifts, plus thematic icons for context like globe markers on maps. Vector precision ensures scalability without pixelation, and batch edits streamline multi-currency updates.
This efficiency empowers data-driven choices with professional finesse.
Best Approaches for Chart Effectiveness
Select Apt Types: Lines for trends, bars for comparisons.
Annotate Wisely: Highlight peaks with callouts for key events.
Integrate Interactivity: Link to sources via clickable elements.
Review Metrics: Align visuals to KPIs for relevance.
These practices sharpen your financial storytelling.
Proven Impacts and Creative Integrations
A trader employed "International Currency Exchange" charts to forecast EUR shifts, vivid maps securing a major hedge. In marketing, "Analytics in Marketing" adapted for ROI visuals, funnel diagrams clarifying spend efficacy and lifting campaigns.
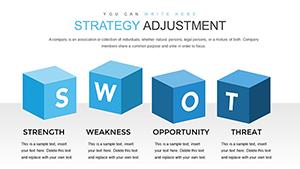
Innovate: overlay world maps on strategy adjustments for geo-financial views or fuse infographics with tactical plans for holistic reports. These merges enrich analytical depth.
From $15, our suite fuels fiscal foresight. Download and delineate your data destiny.
Frequently Asked Questions
Which metrics fit these charts best?
Exchange rates, trade volumes, and inflation indices shine through their versatile formats.
Full editability in PowerPoint?
Complete, with drag-and-drop for data and styles.
Boost slide engagement how?
Via hover effects and transitions that reveal layers progressively.