Well-structured content is the backbone of effective presentations. Our PowerPoint content diagram templates help you organize information, guide audience flow, and present complex structures with clarity and visual appeal.
Thoughtfully designed for readability, these templates feature hierarchical layouts, flow arrows, connected nodes, and modern typography that make navigation intuitive.
Perfect for outlines, agendas, content strategies, and process explanations.
Clear content diagrams act as roadmaps, helping audiences follow your narrative and retain key points. They transform dense information into digestible segments while maintaining visual harmony.
From simple agendas to detailed content calendars, structured visuals enhance comprehension and professionalism.
Over 90 templates offer diverse approaches to content organization.
All optimized for PowerPoint with contemporary styling.
Set expectations with beautiful table of contents slides that preview your talk structure.
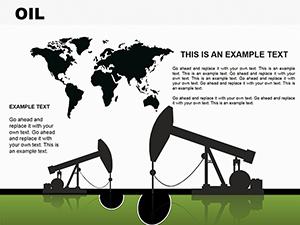
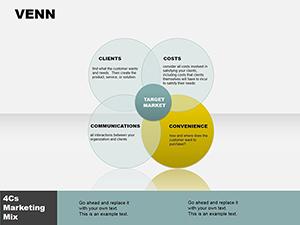
Map content pillars, editorial calendars, or distribution channels for marketing teams.
Organize course modules, lesson plans, or learning pathways for instructors.
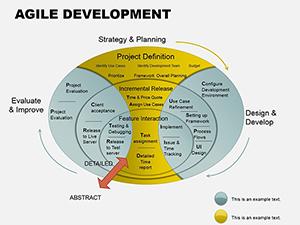
Outline deliverables, phases, and dependencies in project kickoffs.
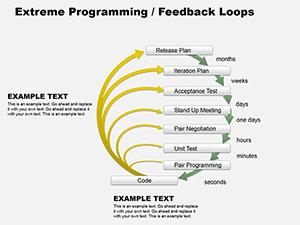
These diagrams help presenters maintain logical flow throughout their decks.
Standard SmartArt lacks design finesse. Our templates provide pre-balanced layouts, coordinated colors, custom icons, and animation timing that create polished, cohesive slides instantly.
Choose a content diagram template today and give your presentation perfect structure.
Recommendations include:
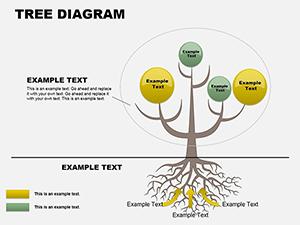
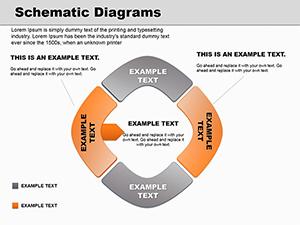
Creative idea: Use circular layouts for cyclical content processes or linear for sequential narratives.
Combine with icons to make each section instantly recognizable.
Table of contents, mind maps, flowcharts, timelines, and hierarchical structures.
Yes, all templates are built for flexible node management in PowerPoint.
Many templates feature sequenced animations for revealing content structure.
Yes, the collection includes multiple free professional templates.
Most are compatible with PowerPoint 2016 and newer, with full features in recent versions.
Copyright © 2009-2026 ImagineLayout All rights reserved.