Bring abstract ideas to life with our concept PowerPoint diagram templates, ideal for innovators, project managers, and thought leaders. These diagrams distill complex concepts into structured visuals, from radial mind maps to sequential flowcharts, fostering clarity in every discussion.
Whether outlining business models or creative processes, the templates offer flexible nodes, connectors, and color-coded branches that adapt to your unique narrative. Insert icons for quick associations and animate paths to guide viewer focus seamlessly.
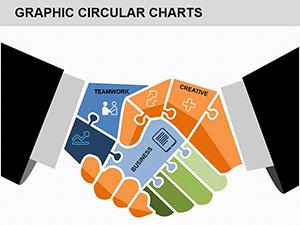
Targeted at teams in consulting and design, these resources spark collaboration, turning solo sketches into shared visions that propel projects forward.
Delve into the concept diagrams category and connect your thoughts effortlessly.
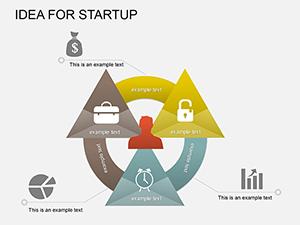
Concept PowerPoint diagram templates are gateways to organized thinking, enabling users to externalize and refine ideas with elegance. In dynamic environments like startups and R&D labs, they bridge intuition and execution, making intangible strategies tangible.
Product developers sketch user experience journeys, branching from pain points to solutions. Writers plot novel arcs, with character webs linking motivations to plot twists. HR specialists map talent pipelines, funneling recruitment stages into outcome projections.
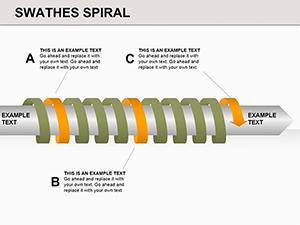
Stock shapes in PowerPoint feel rigid; our templates provide organic curves and hierarchical layers, with smart alignment for effortless expansions.
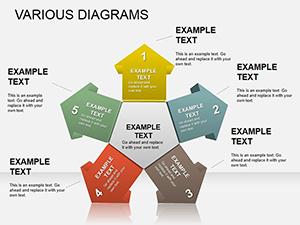
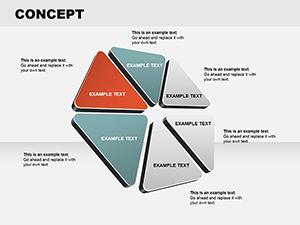
Visualize a strategy session: a central "innovation hub" radiates to market trends, tech enablers, and risk mitigators, clarifying paths to breakthrough.
Marketing teams ideate campaigns, clustering themes around consumer personas. Educators diagram historical events, timelines weaving causes and effects. Therapists chart emotional progress, circular diagrams circling growth milestones.
Engineers conceptualize systems, block diagrams interfacing components for prototype clarity.
Initiate with a core question bubble, then radiate supporting elements chronologically. Balance density - limit branches to five per level for digestibility. Use consistent line weights to denote relationships, strengthening causal links visually.
Integrate hyperlinks to detail slides, expanding nodes on demand for deeper dives.
Diagram your destiny - download these essentials.
Infuse interactivity: make nodes draggable for audience participation in workshops. For reports, evolve static maps into animated evolutions, showing idea maturation over time.
Cross-pollinate with photos - overlay concept sketches on real-world analogs for relatability.
Connect and conquer - grab yours.
Copyright © 2009-2026 ImagineLayout All rights reserved.