Harness the power of visuals with our specialized PowerPoint diagram templates, designed to decode complex datasets into intuitive graphics. Tailored for data analysts, project leads, and speakers, these tools ensure your insights land with precision and persuasion.
From hierarchical trees to interconnected networks, each template features drag-and-drop components that adapt to your narrative. Gain an edge over plain spreadsheets by embedding dynamic elements that update automatically, keeping your presentations fresh and relevant.
Scroll through options and pick diagrams that fit your story. Easy downloads put professional-grade visuals at your fingertips.
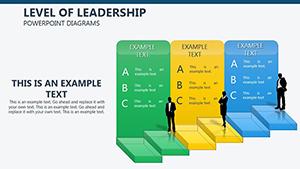

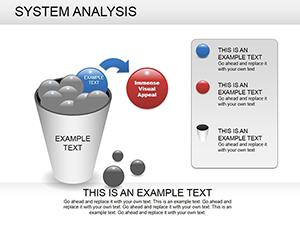
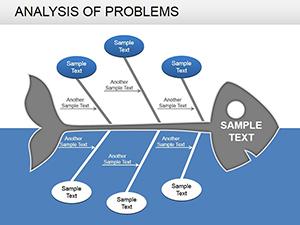
Diagrams are the backbone of effective communication in data-heavy environments. Project managers deploy swimlane templates to delineate responsibilities across teams, clarifying workflows in cross-functional meetings. Analysts favor scatter plot designs for trend identification, plotting variables to uncover correlations effortlessly.
In healthcare, sequence diagrams outline patient care pathways, enhancing training modules. Tech teams use entity-relationship models to blueprint database structures, streamlining development discussions.
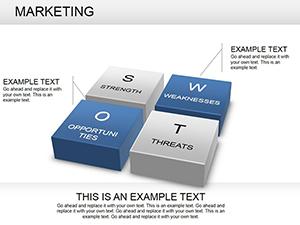
Instructors build concept maps for curriculum mapping, linking objectives to assessments. Innovators apply force-field analyses to weigh change drivers, fueling brainstorming workshops.
Basic PowerPoint shapes demand tedious adjustments, often leading to inconsistent aesthetics. Our templates arrive pre-formatted with theme synchronization, ensuring harmony across your deck. They outperform add-ins by avoiding bloat, running natively for superior performance.
Users note enhanced collaboration via shared links, with version history preserving iterations. This results in 35% quicker visualization builds, amplifying productivity.
Standout perks include scalable vectors for 4K exports and integration with Excel for live data pulls. Templates also embed tooltips for interactive hover effects during virtual sessions.
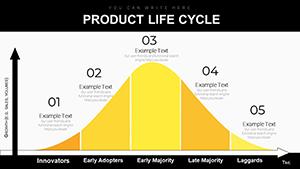
Implementation advice: Align diagrams with slide objectives - use radial layouts for central ideas, linear for sequences. Employ consistent icons to reinforce themes, and validate accuracy with peer reviews. For voiceovers, pair with build animations to sync revelations with speech.
An e-commerce brand utilized our funnel diagram to track conversion drops, pinpointing UX friction - lifting sales by 18%. A research lab`s ecosystem model, drawn from our network template, illustrated biodiversity links, captivating grant panels.
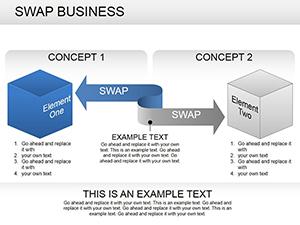
Blend types, like overlaying heat maps on geographic diagrams for sales territory insights, unlocking deeper analytics.
Examine our PowerPoint diagram assortment and secure downloads that fit. Start visualizing success with tools that clarify and convert.
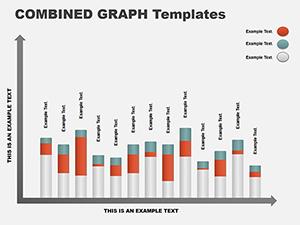
Styles range from flowcharts and mind maps to matrices and radial charts, all PowerPoint-ready.
Yes, linked charts refresh from source files like Excel during edits.
Templates come with preset builds; customize via the animation tab for tailored pacing.
Easily export to PNG, SVG, or PDF for reports and social shares.
Each template includes a quick-start guide with editing walkthroughs.
Copyright © 2009-2026 ImagineLayout All rights reserved.