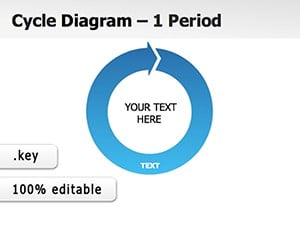
Bring interconnected ideas to life with our selection of circular Keynote diagrams. Ideal for illustrating cycles, relationships, and feedback loops, these templates are essential for professionals in project management, education, and design who seek to clarify complex dynamics visually.
From circular flow models in economics to process wheels in team workflows, our designs capture the essence of continuity and interdependence. Built for Keynote`s robust tools, they allow effortless resizing, recoloring, and animation sequencing to match your story`s rhythm.
Envision a sustainability presentation where a circular diagram rotates to show resource recycling - engaging and memorable. Or use it in a marketing funnel to depict customer journeys looping back for retention. These templates turn abstract concepts into intuitive graphics that foster understanding and discussion.
Dive into this category and discover how circular visuals can enhance clarity and creativity in your slides. Start exploring now for polished, professional results.
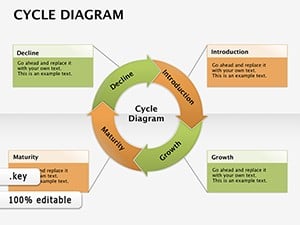
Circular diagrams excel at representing ongoing processes and mutual influences, making them a staple in diverse fields. In business strategy, employ them to map supply chain cycles, highlighting how each stage feeds into the next for efficiency gains. Educators use these for biology lessons on life cycles or history timelines that loop through eras.
Marketers craft customer experience wheels, showing touchpoints from awareness to advocacy and back. In software development, illustrate agile iterations with segmented circles denoting sprints and reviews. The beauty lies in their symmetry, which naturally draws the eye and reinforces holistic thinking.
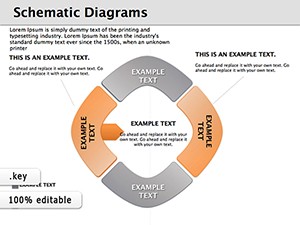
For operations teams, a multi-ring diagram can outline production flows, with inner circles for core tasks and outer for dependencies, animated to simulate real-time progression.
Teachers presenting water cycles benefit from color-coded segments that fade in sequentially, aiding retention through visual storytelling.
While linear flowcharts suit sequential steps, circular diagrams better convey recurrence and balance, avoiding the endpoint bias of straight arrows. Standard Keynote shapes often result in clunky, uneven designs that distract rather than inform. Our templates provide perfectly proportioned vectors with smart guides for alignment, saving hours of tweaking.
They incorporate subtle gradients and stroke variations for depth, unlike flat defaults that appear dated. Plus, built-in hyperlinks turn segments into interactive hotspots, enhancing navigation in large decks.
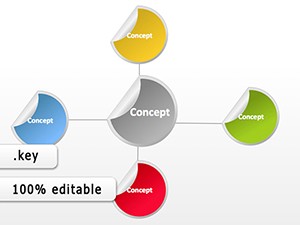
Our circular diagrams stand out with modular builds - start simple with a basic ring and expand to Venn-style overlaps for nuanced relationships. Tip: Use contrasting colors for emphasis, like warm tones for growth phases and cools for challenges, to guide viewer focus subconsciously.
Best practice involves limiting segments to seven for cognitive ease, pairing with concise labels. UVP: Eco-friendly themes integrated, perfect for circular economy talks, with leaf icons and sustainable palettes.
In a team retrospective, animate a circle to "spin" feedback categories, revealing insights progressively. For product roadmaps, concentric circles denote phases, with spokes for milestones.
Browse our collection and infuse your presentations with the elegance of circular logic.
Elevate your visuals today - select a circular diagram template and cycle through success.
Copyright © 2009-2026 ImagineLayout All rights reserved.