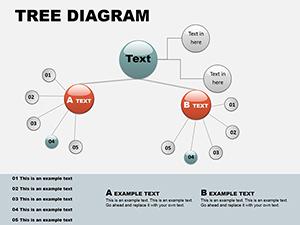
Convey interconnected ideas through our PowerPoint circle diagrams, emphasizing continuity and balance. For business analysts, educators, and project leads, these diagrams provide robust frameworks for complex data.
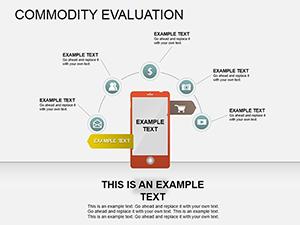
Encompassing cycle arrows for processes and bullseyes for targets, they utilize PowerPoint`s grid for precise placement. Neutral to bold color options fit any deck.
They demystify systems, spurring action in strategy huddles or academic lectures. Vector-based for lossless scaling across formats.
Encircle your message - unlock PowerPoint circle diagram resources.
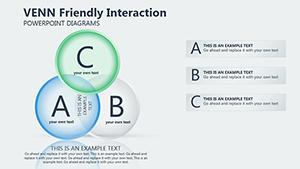
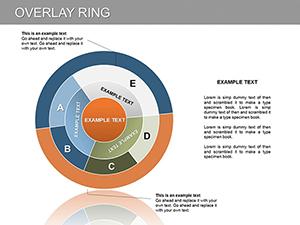

PowerPoint circle diagrams foster unity, trumping fragmented boxes for systemic overviews. Native shapes warp easily; our locked variants ensure integrity with editable overlays.
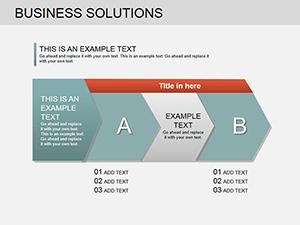
Strategy: Anchor to slides` edges. Elite vs. basic: Embedded morphs for evolution.
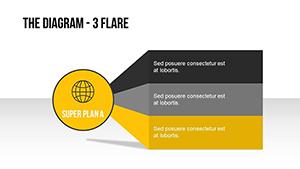
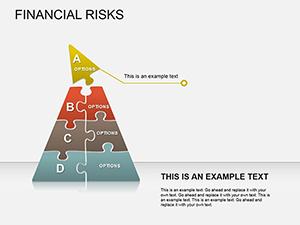
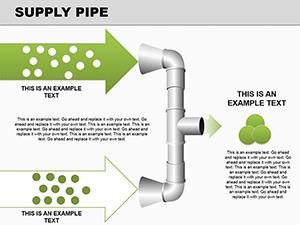
Pipeline view: Sequential circles pulse growth stages. Segment fills dynamically via formulas.
Pro: Formula-driven sizing, cutting manual math by 60%.
Orbit success - diagrams ready for deployment.
Harmony via alignment tools. Restrict to 7 segments max.
Diagrams that drive discourse.
Sustainability decks: Carbon cycle circles trace impacts. Analyst success: Circular orgs clarified restructures.
Hyperlink arcs to sources. Global fit: Metric/imperial toggles.
Hybrid use: Embed in Word reports. Circles complete the picture.
Revolve revelations - PowerPoint circles command attention.
Stock curves constrain; ours liberate in 40% quicker setups, insight intensified.
Copyright © 2009-2026 ImagineLayout All rights reserved.