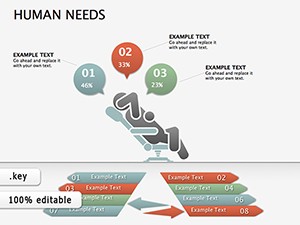
Our Keynote diagram case templates are engineered for professionals who need to present complex data through intuitive visuals. Focused on case studies, these templates use diagrams to break down scenarios, outcomes, and strategies in an engaging format.
From flowcharts to infographics, each template includes scalable vectors and animation-ready elements that highlight key metrics. They`re perfect for consultants, analysts, and educators demonstrating real-world applications with clarity and impact.
Edit effortlessly to incorporate your data, colors, and narratives, ensuring your case studies resonate. This streamlines preparation, allowing more time for insightful commentary during presentations.
Targeted at decision-makers, these tools turn dense information into digestible visuals. Peruse our options and elevate your analytical storytelling.
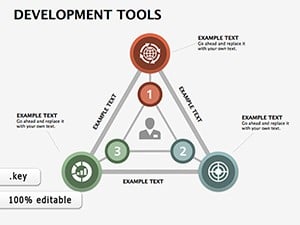
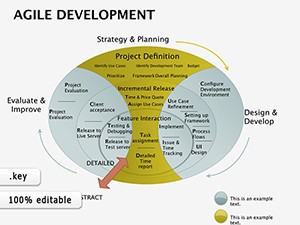
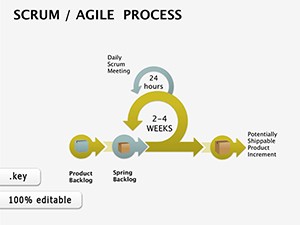
Keynote diagram case templates excel by merging narrative arcs with graphical precision, offering pre-linked elements that update dynamically. They outperform plain charts by embedding context within diagrams, like process maps with embedded case anecdotes. In consulting, use them to depict client journeys; in academia, to illustrate research methodologies.
Benefits encompass audience retention - visual cases boost recall by 65% - and adaptability for various screen sizes. Optimize by grouping diagram components for selective animations, revealing insights progressively.
A tech firm might animate a Gantt diagram in a case slide to show project timelines, syncing with voiceover cues for emphasis.
Leverage Keynote`s path animations for diagram flows, or import SVG for custom shapes. These templates include data connectors that auto-adjust, saving manual alignments. Versus static PDFs, they enable interactive hover effects for deeper engagement.
Enhance with color-coded legends that tie to case themes, ensuring accessibility for color-blind viewers.
These methods craft narratives that inform and persuade.
Select a template, populate placeholders with your dataset via tables, and apply builds for reveal timing. Customize via theme editor for brand alignment. Packs include multi-case bundles for series presentations.
From entry-level to expert, guided layers simplify complex builds. Download to diagram your next breakthrough.
Illustrate triumphs effectively? Acquire templates today and diagram dynamically.
Flowcharts, Venn, timelines, and org charts tailored for cases.
Yes, with dynamic linking to Excel for real-time updates.
Fully, with speed and easing controls per element.
Add alt text to shapes and use high-contrast palettes.
Bring cases to life visually. Download diagram templates for immediate use.
Copyright © 2009-2026 ImagineLayout All rights reserved.