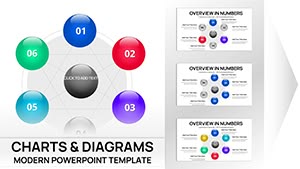
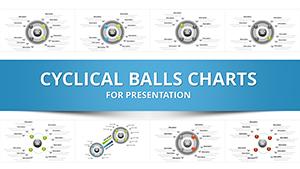
Guide professional growth with our career assessment PowerPoint chart templates, featuring radars, matrices, and progress trackers for evaluating competencies and aspirations. Tailored for HR pros, coaches, and individuals plotting next steps, they illuminate strengths and gaps with data-driven clarity.
Audience-focused benefits: Interactive sliders for self-scoring, comparative overlays for benchmarking, and narrative prompts for reflection. These charts empower decisions, from promotions to pivots.
Chart this category for personalized insights. Swift downloads launch your evaluation - navigate your career compass.


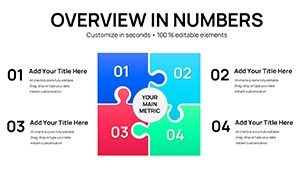
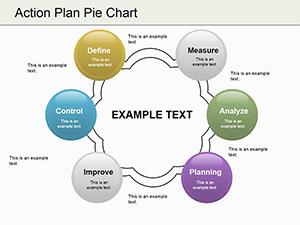
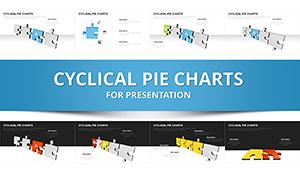
Career assessment PowerPoint chart templates provide multidimensional views that resume summaries miss, with skill radars quantifying potentials for 35% better alignment. Custom axes adapt to industries, trumping rigid forms.
HR workshops score team potentials. Job seekers visualize fits. Mentors track mentee advances.
Insight: Normalize scales for fair comparisons.
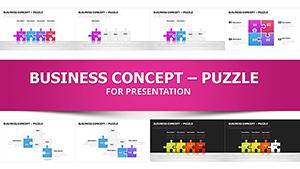
Envision a workshop where participants plot career constellations, sparking dialogues on aspirations. Or a self-audit revealing hidden talents, fueling confidence.
Studies affirm visual feedback accelerates growth; animate fills for progress vibes.
Crafts bespoke analyses.
A firm upskilled staff via charts, cutting turnover 22%. An exec transitioned fields smoothly. Testimonials to transformative tools.
From simple bars to 3D spiders, diversity serves all.
Assess wisely - download charts today and advance.
Clear? Browse development decks further.
Copyright © 2009-2026 ImagineLayout All rights reserved.