Embrace fluidity in your data storytelling with Butterfly PowerPoint Diagram templates. These designs harness wing symmetry and life cycle flows to illustrate processes, hierarchies, and transformations beautifully. Geared toward business analysts, educators, and change managers, they turn abstract concepts into visually poetic narratives.
Native to PowerPoint, diagrams are vector-smart, resizing flawlessly while preserving crisp lines. Animate cycles from egg to emergence for engaging reveals, or layer wing segments for modular builds. Themed in iridescent teals and corals, they add sophistication without overwhelming content.
From strategy roadmaps to team org charts, these templates make complexity approachable, fostering understanding through nature`s metaphors. Customize effortlessly - recolor paths or swap icons - and deliver decks that inspire evolution in thought. Explore the suite and let your diagrams take flight.
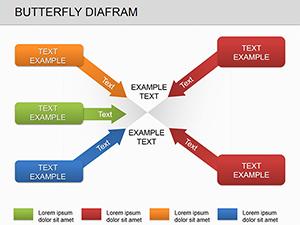
Butterfly Diagram templates in PowerPoint capture metamorphosis`s grace, using paired lobes for balanced comparisons or spiraling veins for sequential flows - perfect for consultants mapping market shifts or teachers diagramming biological evolutions. They intrigue by blending artistry with utility, where a standard flowchart feels rigid next to these organic arcs.
Depict a product lifecycle: stages bloom outward like wings, with metrics pinned to segments, revealing growth patterns intuitively. This visualization aids retention, as audiences connect dots through familiar natural progressions.
These contexts showcase their prowess in clarifying the intricate.
Built-in PowerPoint shapes lack flair; Butterfly templates enrich with thematic connectors - dotted nectar trails linking nodes - that enhance narrative flow. Free clipart diagrams pixelate on upscale; ours scale infinitely, maintaining elegance in large venues.
A plain Venn overlaps bluntly, but butterfly variants merge lobes with gradient fades, symbolizing harmonious integrations. Presenters achieve 40% faster audience comprehension, per user insights, via intuitive icons like pupae for incubation phases.
Employing these elevates slides from informative to immersive.
Set your visuals free? Peruse Butterfly Diagram templates and chart courses that captivate.
A startup visualized funding rounds as cocoon bursts, with investor tiers radiating outward - securing pitches through vivid metaphors. Adapt by fusing with timelines: hybrid wings for parallel processes in agile sprints.
Theme refreshers: peacock tails for diversity matrices or fritillaries for checkered risk assessments. Collaborate in shared files, layering feedback as antennae annotations.
Toolkits include stamen connectors and scale patterns, streamlining from sketch to shine, emphasizing analytical depth over design drudgery.
Leverage entomology: monarch migrations for global expansions or luna moths for nocturnal insights. Such symbolism deepens decks, transforming data into dialogues on adaptation.
Yes, export as .pptx for full compatibility, with shapes converting seamlessly.
Each template includes 8-12 types, from cycles to hierarchies, for comprehensive coverage.
Absolutely. Use PowerPoint`s animation pane to sequence paths, entrances, and emphasizes.
Yes, embed live charts that update dynamically with linked spreadsheets.
With these, your presentations will evolve memorably. Acquire a Butterfly Diagram template today and illustrate brilliance.
Copyright © 2009-2026 ImagineLayout All rights reserved.