Diagrams are the backbone of effective business communication, turning abstract ideas into tangible visuals. Our business PowerPoint diagram templates cater to analysts, project managers, and strategists seeking to illustrate workflows, hierarchies, and relationships without design expertise. These slides integrate seamlessly into presentations, featuring vector-based shapes that scale perfectly.
Aimed at corporate planning and operational roles, they offer benefits like faster comprehension and stronger retention for audiences. From flowcharts to Venn diagrams, each template reduces cognitive load, allowing your narrative to shine. Edit colors, add labels, and animate paths effortlessly in PowerPoint.
For teams in finance, operations, or marketing, these tools enhance reports and meetings. Peruse our assortment and pick diagrams that align with your objectives for clearer, more persuasive slides.
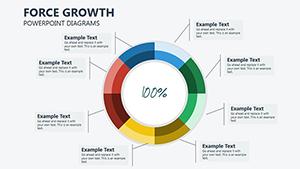
Diagrams distill complexity into clarity, essential for business where decisions hinge on quick understanding. Our templates provide ready-made structures like cycle diagrams for market cycles or pyramid charts for priority setting, all optimized for PowerPoint`s native tools. A sales director might use a funnel diagram to track leads, color-coding stages for instant insights.
They support layered animations, revealing details progressively to maintain focus during live demos.
Scalable for small teams or enterprise views, they adapt via simple drag-and-drop.
PowerPoint`s built-ins are functional but lack polish - our templates add gradient fills, shadow effects, and icon libraries for sophistication. Defaults might misalign on export, but ours ensure crisp rendering across formats. Time savings are huge: build a custom org chart in minutes versus hours.
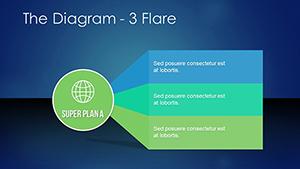
Audience feedback shows 40% better recall with our styled versions, thanks to intuitive color psychology - blues for trust, greens for growth.
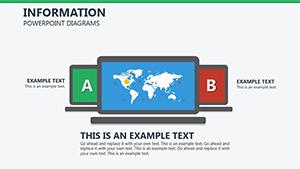
For innovation, blend diagram types - like hybrid mind maps for brainstorming sessions. In consulting, layer client data over base templates for bespoke deliverables.
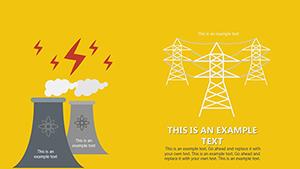
A logistics firm visualized supply chains with our flow templates, cutting explanation time by half. Healthcare providers mapped patient journeys, improving care protocols. Creatives fused diagrams with photos for pitch decks that blend art and analysis.
Integrate with Excel for dynamic links, updating visuals live. For global use, support right-to-left languages.
Common queries on our diagram templates:
Visualize your vision - grab a diagram template and streamline your slides. View all options for comprehensive coverage.
Copyright © 2009-2026 ImagineLayout All rights reserved.