Chart your course to clarity with our business charts Keynote templates, transforming raw data into digestible, design-forward graphics. From org structures to sales funnels, these slides empower leaders to communicate strategies with visual punch.
Crafted for managers, analysts, and consultants, the templates feature drag-and-drop charts, conditional formatting, and trend lines that adapt to your datasets. Animate growth curves or pivot tables for boardroom wow-factor.
Suitable for startups to enterprises, find charts that scale. Browse and boost your briefs.
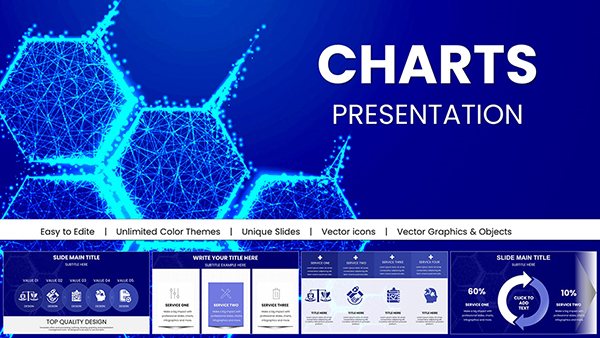
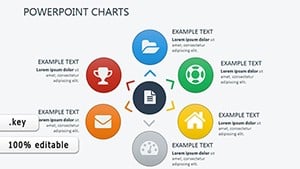
Dynamic Customer Service Skills Charts: Charting Paths to Excellence
ID: #KC00383
$17.00
(132)
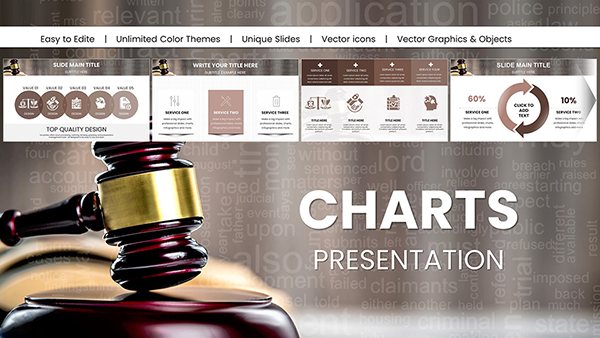
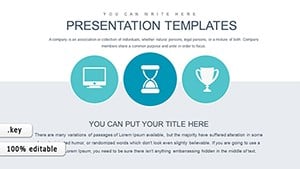
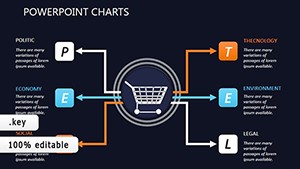
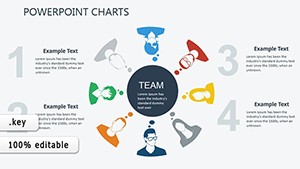
Marketing Charts Keynote Template
ID: #KC00345
$19.00
(918)
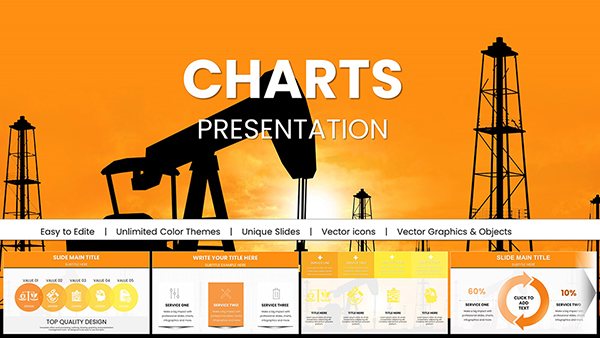
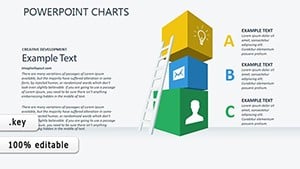
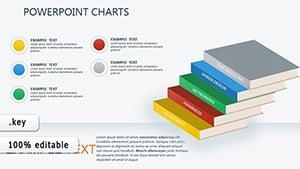
Progress Movement 3D Keynote Charts: Advance with Visual Depth
ID: #KC00341
$18.00
(516)
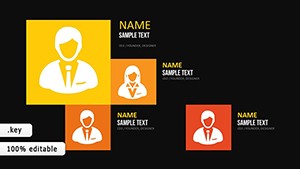
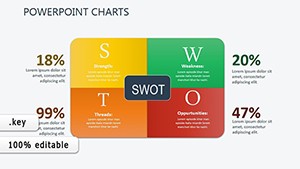
Organizational Behavior Keynote Charts Template
ID: #KC00330
$20.00
(303)
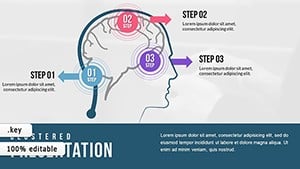
Learning Process Keynote Charts: Unlock Analytical Clarity
ID: #KC00313
$20.00
Empowering Decisions with Visuals
Business charts Keynote templates distill complexities into compelling stories, far beyond Excel dumps. They accelerate comprehension, spurring action in meetings.
For C-suites tracking KPIs or teams brainstorming roadmaps, the interactivity fosters collaboration.
Key Integrations
Data Links: Live updates from spreadsheets.
Infographic Builds: Step-by-step reveals.
Color Gradients: For heat maps and progress bars.
Export Suites: To video or interactive PDFs.
Advanced over basics, with AI-suggested layouts. Hack: Use shapes for custom gauges.
Strategic Use Cases
Deploy in quarterly reviews, where donut charts slice market shares. HR leverages pyramid orgs for restructures.
Marketers map customer journeys with flow diagrams. A fintech firm visualized risk matrices, mitigating board concerns. VCs assess funnels for pitch decks, securing rounds.