Master the art of visual planning with our PowerPoint diagram templates, crafted for business ideas that demand clarity and creativity. These diagrams organize thoughts into coherent frameworks, aiding from ideation to execution.
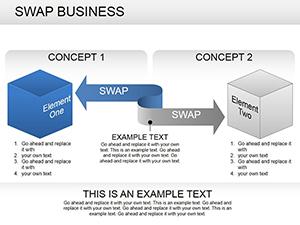
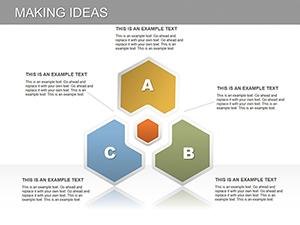
Suited for planners and innovators, templates include arrow flows, concentric circles, and hierarchical trees, all vector-sharp and resize-friendly. Input your details and watch connections form automatically.
Gain an edge with designs that facilitate brainstorming and stakeholder buy-in. Professional yet approachable, they fit any boardroom or virtual huddle.
Map your blueprint - explore and download PowerPoint diagram templates to propel your business forward today.


Powered by SmartArt enhancements, our templates auto-adjust connections and balance layouts dynamically. They overcome rigid defaults with flexible node additions and style galleries.
Focus on strategy, not styling, thanks to one-click theme applications.
Drive planning efficiency.
Roadmap diagrams timeline key initiatives for alignment. Value chain templates dissect operations for efficiency gains.
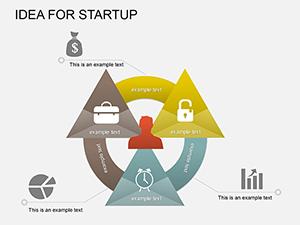
Stakeholder maps circle influences for engagement strategies. Innovation funnels narrow concepts to viable products.
Diagrams fuel informed planning.
PowerPoint`s SmartArt is foundational, but our pre-themed versions add business narratives and icons. Basics need extensive edits; ours are plug-and-play.
| Aspect | Basic SmartArt | Our Set |
|---|---|---|
| Pre-Theming | No | Yes |
| Icon Libraries | Standard | Curated Business |
| Auto-Layout | Limited | Advanced |
Specialized for superior plans.
Choose diagrams reflecting hierarchy - top-down for authority. Standardize symbols across docs, and use hyperlinks for drill-downs. Animate paths for guided tours.
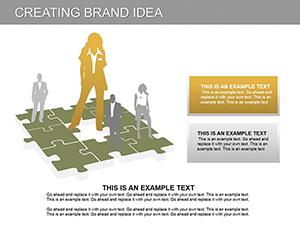
Hybridize with photos for vivid roadmaps. For agile plans, iterative loop diagrams.
Plan purposefully - get diagrams today for structured success.
Copyright © 2009-2026 ImagineLayout All rights reserved.