Bring clarity to intricate business concepts with our expertly crafted PowerPoint diagram templates. These versatile tools, built for Microsoft PowerPoint, help you depict processes, hierarchies, and relationships in ways that resonate with teams and stakeholders alike.
From flowcharting operational workflows to Venn diagrams for overlapping strategies, our collection equips you to communicate ideas with precision and style. Designed for efficiency, they feature modular components that snap into place, minimizing design friction and maximizing focus on content.
Perfect for project managers, strategists, and educators in corporate training, these diagrams foster understanding and collaboration. Replace vague descriptions with visual blueprints that accelerate decision-making. Peruse our offerings and integrate professional-grade visuals into your next deck seamlessly.
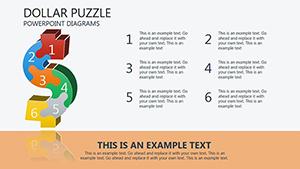
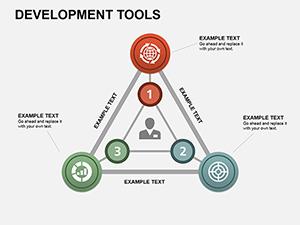
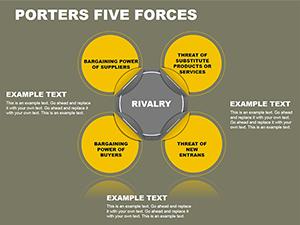
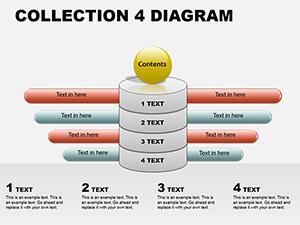
PowerPoint diagrams are indispensable for articulating multifaceted business narratives. In project management, swimlane diagrams delineate responsibilities across departments, streamlining handoffs. For organizational design, pyramid diagrams layer leadership structures, clarifying reporting lines.
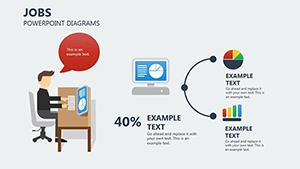
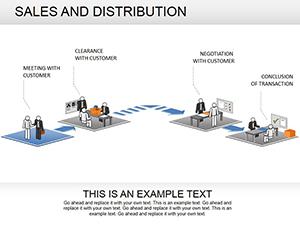
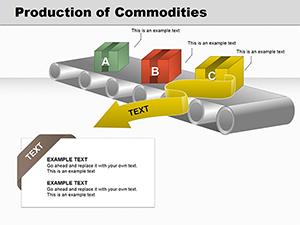
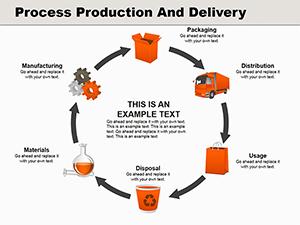
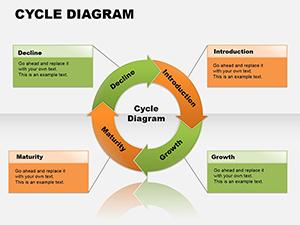
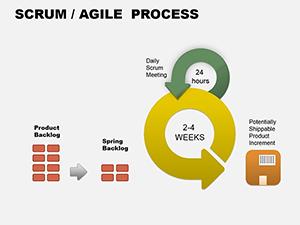
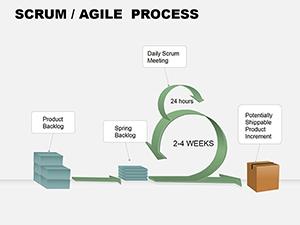
Sales enablement benefits from cycle diagrams illustrating the customer lifecycle, from lead gen to retention. In consulting, matrix diagrams evaluate options like cost vs. benefit, aiding client recommendations.
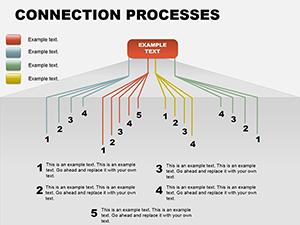
PowerPoint`s connector tools enhance these for dynamic, editable frameworks.
Stock PowerPoint shapes often yield disjointed, amateurish results, requiring constant alignment tweaks. Our templates provide cohesive sets with pre-linked elements and consistent styling, cutting creation time in half. A generic org chart might sprawl unevenly, but ours uses smart guides for balanced, scalable hierarchies.
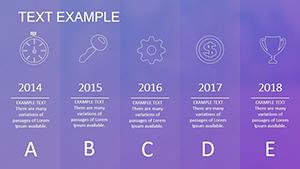
This polish conveys professionalism, boosting presentation confidence and audience trust. Enhanced with thematic icons, they add narrative depth without excess complexity.
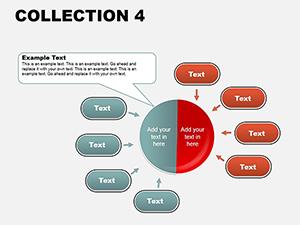
Color-code by function and resize without losing connections, ideal for iterative planning.
Begin with purpose: What action does this diagram drive? Opt for linear flows for processes, radial for influences. Use hierarchy sparingly to avoid top-heaviness, and incorporate whitespace for scannability.
Animate paths progressively to simulate progression, and layer information for depth. Validate with peers for clarity, ensuring universal interpretation.
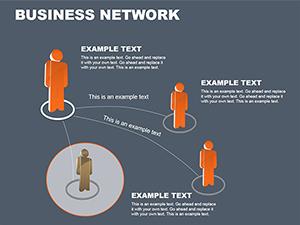
Experiment with Sankey diagrams for energy or resource flows in sustainability pitches, or ecosystem maps for partnership overviews. In agile retrospectives, fishbone diagrams dissect issue roots collaboratively. These approaches turn static slides into interactive tools, enhancing team alignment.
What diagram types are best for process mapping?
Flowcharts and BPMN styles excel, with our templates offering both.
Can diagrams be made interactive?
Yes, via hyperlinks and triggers for engaging explorations.
Do they support team collaboration?
Compatible with PowerPoint Online for real-time edits.
How to handle large datasets in diagrams?
Use grouped elements and zoom features for manageable views.
Are custom shapes included?
Extensive libraries of icons and connectors for uniqueness.
Export options for print?
High-res PDF output preserves vector sharpness.
Diagram your path to business clarity. Download these PowerPoint templates and start mapping success stories.
Copyright © 2009-2026 ImagineLayout All rights reserved.