Present business insights with impact using our PowerPoint templates for reports, featuring slide sequences that guide viewers through data narratives. Ideal for board meetings or team updates, they include agenda builders, metric overviews, and conclusion calls-to-action.
Targeted at presenters in consulting, finance, and management, these decks turn numbers into stories with integrated visuals and minimal text for maximum retention.
Editable animations and transitions keep energy high, while master slides ensure brand consistency. From sales pipelines to risk assessments, adapt them to fit any reporting need.
Empower your presentations - explore the library and choose your perfect fit now.
Europe Economy PowerPoint Template: Eurozone Visions Unveiled
ID: #PP01253
$12.00
(731)
Money Wallet PowerPoint Template
ID: #PP01251
$12.00
(130)
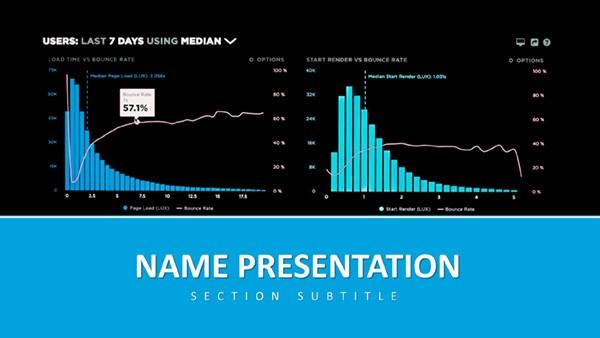
Efficient Activity Analysis PowerPoint Template
ID: #PP01052
$10.00
(995)
Money Exchange PowerPoint Template
ID: #PP00246
$10.00
(348)
Financial Analysis PowerPoint Template Mastery
ID: #PP00061
$10.00
Broad Use Cases in Professional Settings
These templates adapt to myriad scenarios. Executives use them for earnings calls, with revenue funnels animating growth trajectories. Project managers showcase milestones in agile retrospectives, embedding burndown charts.
Marketing reports highlight campaign ROI through heatmap slides, while R&D teams visualize innovation pipelines.
Outshining Standard PowerPoint Designs
Basic slides lack narrative flow; ours offer story arcs with themed transitions, reducing prep by half and boosting engagement scores via audience polls.
Distinctive Elements and Pro Tips
Highlights include smart art for org charts and data-driven icons. Advice: Limit slides to 10-15, rehearse timings, and use speaker notes for depth without clutter.
Innovate by adding VR previews for immersive data tours.
Concrete Examples
Quarterly Earnings Deck: 12 slides with P&L breakdowns.
Market Entry Strategy: Geo-maps and SWOT visuals.
Employee Engagement Report: Survey graphs with trend lines.
Proven to clarify complex info effectively.
Maximizing Presentation Success
Sync with Teams for hybrid delivery, maintaining quality across devices.
Inspire action - grab a template and shine.
Frequently Asked Questions
Master compelling reports with these powerhouse tools.