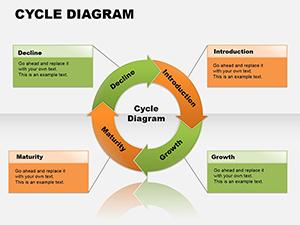
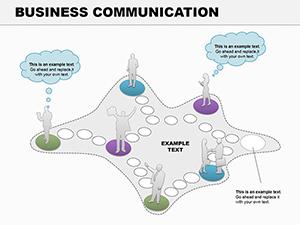
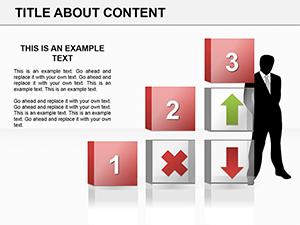
Illuminate your strategies with business process diagram templates tailored for PowerPoint. These intricate visuals connect nodes, arrows, and annotations to depict end-to-end operations clearly. Crafted for strategists, trainers, and analysts, they facilitate deep dives into efficiencies and innovations.
Capitalize on connector tools, thematic icons, and morph transitions for fluid storytelling. Surpass scattered notes with diagrams that unite teams around shared visions, adaptable to any scale.
Examine our diagram range and identify matches for your projects. Secure downloads to diagram your way to excellence.
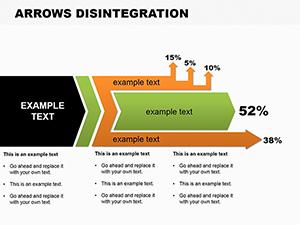
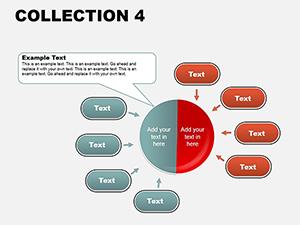
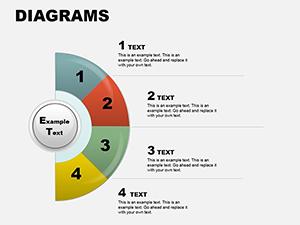
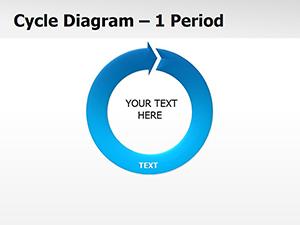
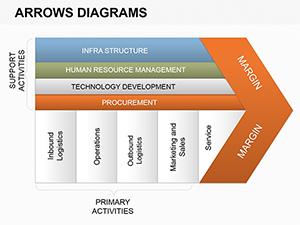
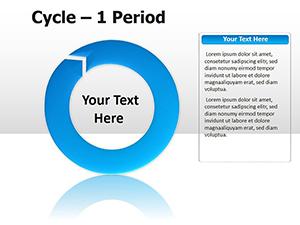
Process diagrams weave elements into cohesive maps, exposing redundancies and synergies. They dominate over lists by spatializing info, vital for change management in retail or tech.
Enhanced beyond stock diagrams, ours auto-route lines and support grouping for complex nests.
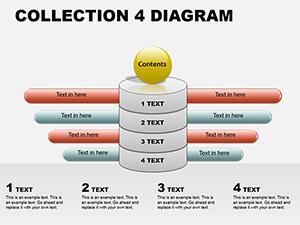
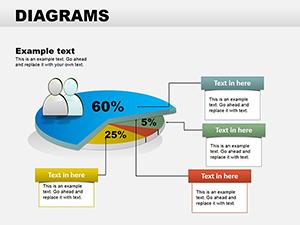
Standouts: Hierarchical expansions and data-driven sizing. Guidelines: Employ legends for symbols, animate builds for revelations, and align to grids for precision.
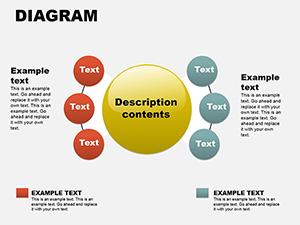
Conceive a turnaround plan: diagrams branch from root causes to solutions, rallying buy-in visually.
Map mastery awaits - view diagram templates and adapt.
Diagrams spark ideation by visualizing `what-ifs,` fueling iterative improvements.
Enable co-editing for collective shaping of futures.
Diagram your destiny - choose and download now.
Copyright © 2009-2026 ImagineLayout All rights reserved.