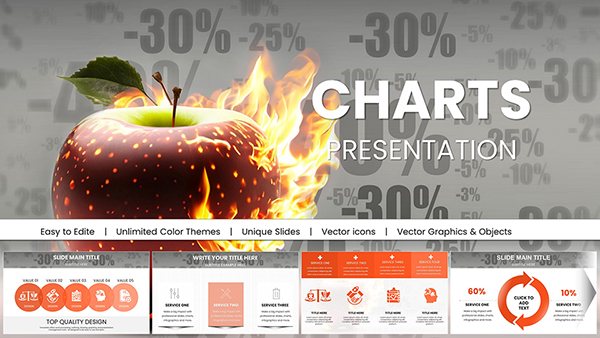
Transform how you illustrate business processes with our curated Keynote charts collection. These templates are engineered to map out workflows, timelines, and cycles with precision and elegance, turning dense procedures into digestible visuals. Perfect for project managers, operations leads, and consultants who need to communicate strategies effectively.
Our charts feature clean lines, intuitive icons, and flexible layouts that adapt to your narrative. Whether depicting supply chains or decision trees, they help audiences follow along without missing a beat. Save time on formatting and focus on delivering insights that drive decisions.
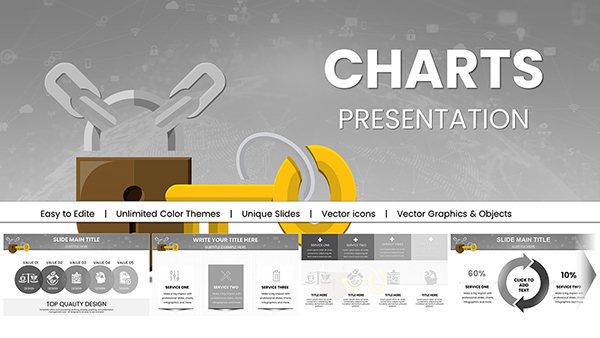
From Gantt-style overviews to flowchart integrations, each template is ready to customize in Keynote`s native environment. Dive into our business process charts now and make your next meeting more productive and visually compelling.

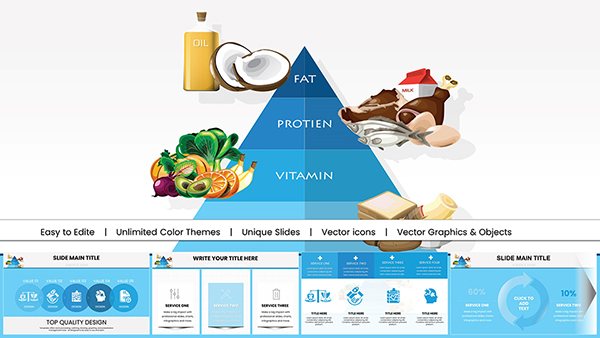
Effective process visualization prevents misunderstandings and accelerates buy-in from stakeholders. Keynote`s robust tools shine when paired with our specialized charts, offering smoother animations and higher fidelity than generic options. These designs emphasize flow and progression, using arrows, nodes, and color-coded segments to highlight bottlenecks or milestones.
In contrast to basic shapes, our templates incorporate best-in-class infographics that scale effortlessly. A typical business process chart might outline a sales funnel from lead gen to close, with expandable sections for deeper dives during Q&A.
Users often note a 40% reduction in explanation time when using these visuals over text-heavy slides. They`re particularly valuable in remote settings, where screen sharing demands clarity.
Begin with a clear objective: Is your chart sequential or hierarchical? Our library includes both, with tips for layering information without overload. Opt for sans-serif fonts and consistent spacing to maintain a polished look. For dynamic presentations, leverage Keynote`s build-in transitions to simulate process evolution in real-time.
Pro tip: Integrate data links from spreadsheets for live updates, keeping your charts always current. This feature is a game-changer for executive dashboards or investor updates.
Consider a marketing team visualizing campaign rollouts: A horizontal process chart sequences phases from ideation to metrics, with icons for each handoff. In manufacturing, vertical flowcharts trace assembly lines, color-coding for quality checks. One agency client used our templates to pitch a client restructure, resulting in a swift contract win thanks to the crystal-clear workflow depiction.
Experiment with hybrid charts combining processes with KPIs - embed gauges or progress bars within nodes for at-a-glance performance tracking. These adaptations make standard processes feel fresh and tailored.
Our Keynote charts stand out for their user-centric design, prioritizing accessibility with high-contrast options and alt-text ready elements. Each pack comes with variant layouts, so you can A/B test visuals for different audiences. Whether you`re a solo entrepreneur or part of a global firm, these tools democratize professional design.
Don`t settle for static slides - grab a business process chart template today and watch your communication transform. With unlimited edits, the possibilities are endless.
Copyright © 2009-2026 ImagineLayout All rights reserved.