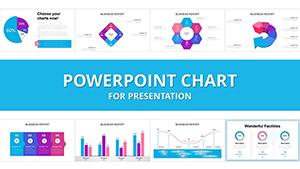
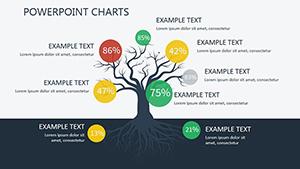
Visualize operational dynamics through our business activities chart templates for PowerPoint. Tailored for data analysts, performance reviewers, and department heads, these slides convert activity logs into insightful graphics that reveal patterns and progress.
Encompassing bar graphs for task distributions and line charts for trend tracking, they simplify reporting. Advantages include quicker comprehension and persuasive storytelling in reviews or audits.
Harness PowerPoint`s charting prowess with pre-formatted, theme-consistent designs. Review options to pinpoint the chart style suiting your activity focus.
Construction Company PowerPoint Charts Template: Download Presentation
ID: #PC00526
$21.00
(708)
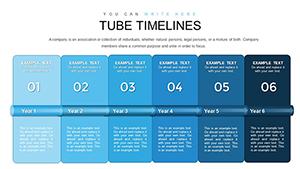
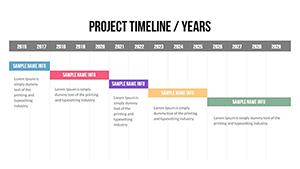
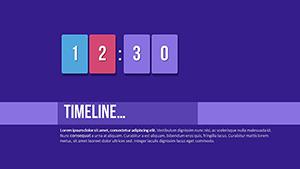
Project Timeline PowerPoint Charts Templates
ID: #PC00500
$20.00
(960)
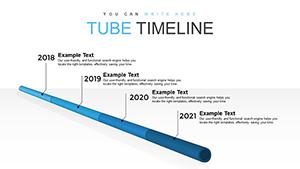
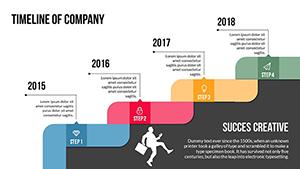
Dynamic Company Timeline PowerPoint Charts Template
ID: #PC00498
$20.00
(400)
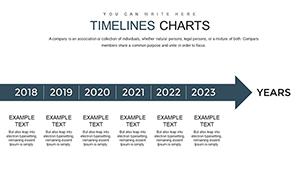
Timeline Maker PowerPoint Charts Template
ID: #PC00497
$21.00
(677)
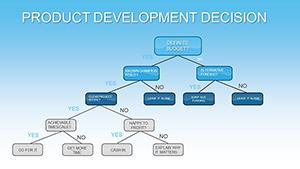
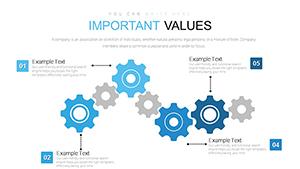
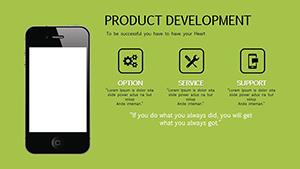
Dynamic Product Development Charts - Fully Editable PPTX | ImagineLayout
ID: #PC00447
$18.00
(1176)
Implementation System PowerPoint Charts Template: Elevate Your Data Storytelling
ID: #PC00425
$18.00
(737)
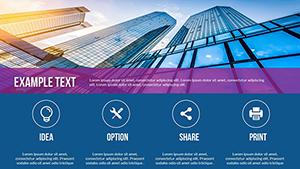
User Experience PowerPoint Charts for Professional Presentations
ID: #PC00404
$12.00
(761)
Sustainable Development PowerPoint Charts Template: Visualize a Greener Future
ID: #PC00394
$13.00
(571)
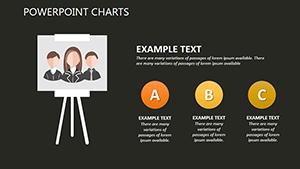
HR Employee Analytics PowerPoint Charts
ID: #PC00381
$20.00
(826)
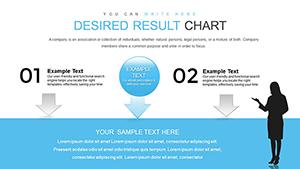
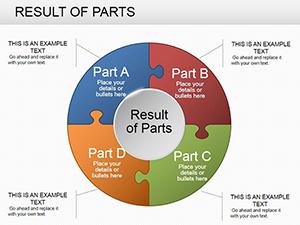
Result Parts PowerPoint Charts: 24 Data Viz Slides
ID: #PC00236
$20.00
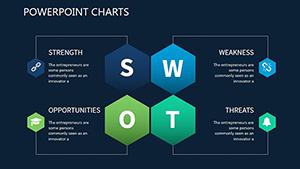
Strategic Uses for Activity Charts
Sales teams graph lead conversions, correlating activities with revenue spikes. Project managers dashboard milestone achievements, using stacked bars for resource views.
HR tracks training engagements, pie charts showing completion rates. Marketing measures campaign interactions, heat maps for engagement zones.
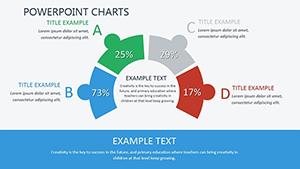
Superior to Native Charts
Built-in PowerPoint charts are basic; ours add annotations and trend lines, delivering nuanced views without manual tweaks.
Highlighting Innovations and Techniques
Unique: Conditional formatting for real-time alerts. Techniques: Align charts with narrative text, vary types for emphasis, and animate data entry for reveals.
Creative: Overlay activity charts on timelines for holistic overviews.