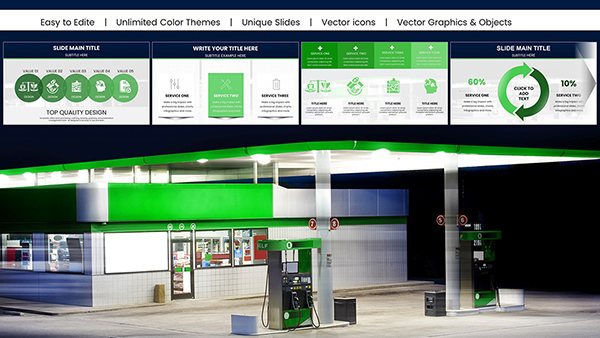
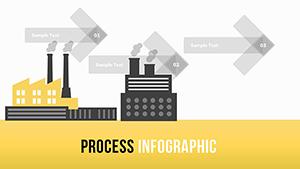
Clear visualization of build processes keeps projects on track and stakeholders aligned. Our build chart templates for PowerPoint provide professional tools to illustrate timelines, stages, dependencies, and progress with ease.
Featuring over 100 fully editable and animated designs, including Gantt charts, flow diagrams, roadmap layouts, and progress trackers, these templates suit construction, development, and business initiatives.
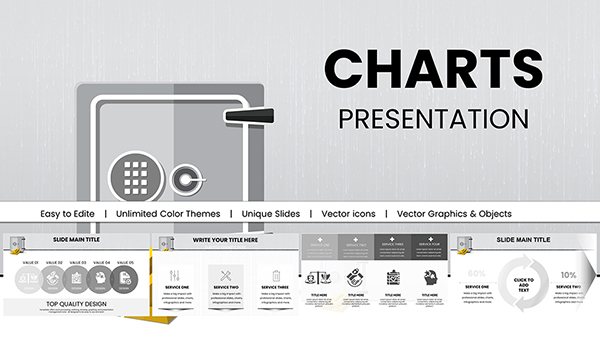
Save time on formatting and focus on delivering updates that everyone understands. Updated for current trends, they offer clean layouts and customizable elements.
Start creating more effective project presentations today.
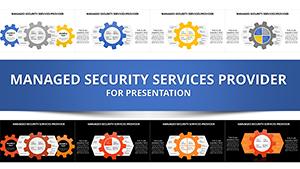
Basic charts struggle to show dependencies and timelines effectively. Our specialized templates include advanced Gantt features, animated progress builds, and professional styling that make complex projects simple to present.
Benefits include clearer communication, faster updates, and more engaging status reports.
Professional designs help teams spot delays early and celebrate milestones visually.
Ideal for:
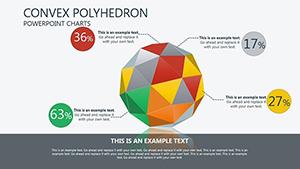
A well-designed Gantt chart, for instance, can instantly show task overlaps and critical paths to keep everyone aligned.
Best practices include:
Explore our build chart templates and download one free to try these techniques!
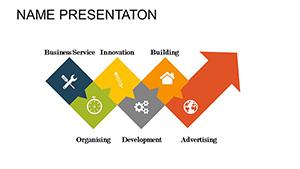
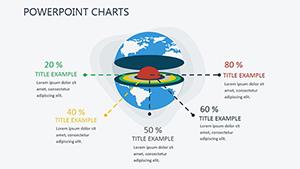
Our collection features Gantt charts, horizontal timelines, vertical flow diagrams, circular progress wheels, and roadmap layouts - all optimized for project builds.
Yes, many feature fully functional, editable Gantt designs.
Most include animations to show progress builds dynamically.
Yes, everything is fully customizable in PowerPoint.
Yes, numerous free options with premium upgrades.
Copyright © 2009-2026 ImagineLayout All rights reserved.