Master the art of organized presentations with our box diagram templates for PowerPoint, crafted to compartmentalize information into digestible, visually appealing segments. These templates are a go-to for analysts, project leads, and educators seeking to present structured data without overwhelming their audience.
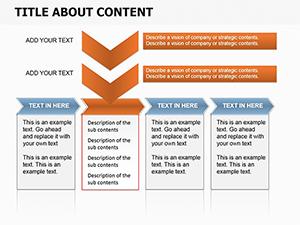
Box diagrams excel at delineating categories, such as SWOT analyses or decision trees, using clean, rectangular forms that promote logical flow. Geared toward business and academic users, they eliminate the guesswork in layout design, offering ready-to-use frameworks that align with professional standards.
Effortlessly tweak borders, fills, and connectors to suit your narrative. From quarterly reports to lesson plans, these diagrams clarify relationships and priorities, enhancing message retention. Compatible with all PowerPoint versions, they ensure seamless integration into your workflow.
Scan our assortment of box PowerPoint diagrams and select templates that box up your ideas perfectly. Get started now to deliver presentations that are as structured as they are striking.
Box diagrams provide a foundational structure for conveying layered information in PowerPoint. In project management, they outline phases via connected boxes, detailing tasks, timelines, and responsibilities for crystal-clear overviews. Legal teams use them for case breakdowns, enclosing evidence categories to streamline arguments.
In retail analytics, Venn-style box overlaps highlight market segment intersections, aiding inventory decisions. Human resources departments diagram org charts, with nested boxes showing reporting hierarchies. Scientific researchers employ them for experimental designs, boxing variables and outcomes to facilitate peer reviews.
By confining elements to boxes, these diagrams prevent slide clutter, allowing focus on interconnections via arrows or lines. This method supports quick scans, ideal for time-sensitive meetings.
PowerPoint`s built-in shapes often yield amateurish results due to inconsistent sizing and limited styling options. Our box templates offer pre-aligned grids and thematic variants, ensuring professional polish from the start. Defaults require manual adjustments for multi-level nesting, whereas ours include smart connectors that auto-update.
They also incorporate subtle shadows and gradients for depth, absent in basics, creating a more dynamic yet non-distracting appearance. This elevates perceived expertise, setting your work apart in competitive environments.
Choose our templates for diagrams that box in efficiency and exude quality.
Begin with a content audit: assign one idea per box to avoid overcrowding. Use varying box sizes to denote importance - larger for key points. Employ color coding consistently: neutrals for backgrounds, accents for highlights.
For advanced setups, layer semi-transparent boxes for overlaps, visualizing intersections like in risk assessments. Animate sequentially to reveal hierarchy, building understanding step-by-step. Collaborate by sharing editable files, enabling team input without reformatting.
Transform your PowerPoint game - download box diagram templates and organize your success story today.
Engineering firms box component assemblies, linking specs for prototype reviews. Media planners use them for content calendars, enclosing themes and deadlines. Fitness coaches diagram workout routines, with boxes for warm-ups, circuits, and cool-downs.
Government agencies outline policy frameworks, nesting objectives within broader goals. These uses showcase the templates` utility in structuring diverse narratives effectively.
A marketing agency cut revision cycles by 50% using nested box diagrams for campaign briefs. An academic paper`s acceptance rate rose with clearer methodology visuals. Real impacts like these validate the investment in quality templates.
Access our box PowerPoint diagram templates now and bring order to your slides with professional flair.
Copyright © 2009-2026 ImagineLayout All rights reserved.