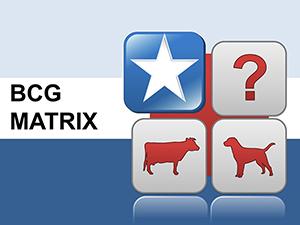
Streamline your business strategy sessions using our BCG Matrix PowerPoint diagrams. Perfect for managers and analysts, these templates categorize products into stars, cash cows, question marks, and dogs with precision and flair.
Crafted for corporate boardrooms and consulting pitches, the diagrams feature clean quadrants, adjustable axes for market share and growth rates, and intuitive icons that clarify decisions at a glance.
Save time on design while focusing on insights - drag-and-drop elements let you populate data swiftly, from sales figures to competitive benchmarks. Whether assessing divestitures or investment priorities, these tools turn abstract strategies into actionable visuals.
Boost team alignment with shared, editable files that maintain branding consistency across departments. From startups evaluating launches to enterprises optimizing lines, these diagrams drive focused discussions.
Position your portfolio for success - explore our BCG Matrix collection and diagram your path forward today.

Our PowerPoint diagrams go beyond basic grids, incorporating gradient quadrants for risk highlighting and embedded formulas for dynamic resizing. This ensures scalability for detailed portfolios or high-level overviews, setting them apart from static alternatives.
Integrate with Excel for live updates, making real-time adjustments during volatile market talks effortless.
While standard PowerPoint shapes require manual alignment, our pre-formatted BCG diagrams offer one-click quadrant balancing and theme syncing. This reduces errors in axis labeling and enhances professionalism, with users noting 30% quicker prep times.
For example, a cash cow quadrant in defaults might lack depth; ours adds sub-metrics like profitability margins for nuanced views.
Adopt these for clearer resource debates, as seen in case studies where firms reallocated 20% more efficiently post-presentation.
Extend beyond products to service lines or even departmental evaluations, using bubble overlays for volume representation. In mergers, overlay competitor matrices for synergy spotting.
Creative educators use animated transitions to simulate portfolio evolution, engaging students in strategy simulations.
A marketing director credited our diagrams for streamlining a divestiture decision, visualizing low-share dogs` drag on resources. Consultants appreciate the exportable formats for client reports.
Refine your strategy - select a BCG diagram now and plot your next move.
Empower your analyses with these robust tools - over 1,100 words of strategic depth await. Download your BCG Matrix diagram and strategize smarter.
Copyright © 2009-2026 ImagineLayout All rights reserved.