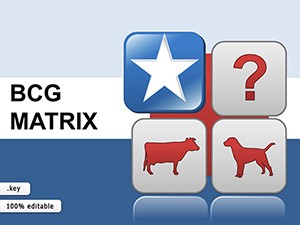
Navigate competitive landscapes with precision using our BCG Matrix Keynote diagrams, essential for executives, analysts, and strategists. These templates distill the Boston Consulting Group framework into intuitive four-quadrant visuals - stars, cash cows, question marks, and dogs - facilitating swift portfolio evaluations.
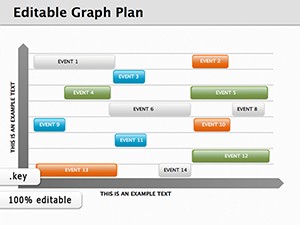
From annual planning retreats to merger assessments, they clarify resource allocation with color-coded placements and metric overlays. Drag-and-drop functionality lets you populate with real data, while subtle animations highlight shifts over time.
Uncover diagrams that simplify complexity, from basic grids to advanced multi-matrix comparisons. Arm your Keynote presentations with tools that inform bold, data-backed moves.


Fortune 500 firms wield these in board meetings, plotting product lines to prioritize investments in high-growth stars while divesting underperformers. Marketing teams refine campaigns by quadrant, targeting question marks with innovative pushes.
Startups benchmark against incumbents, using matrices to spotlight cash cow extensions funding R&D. Academic strategy courses dissect case studies, like GE`s diversification, through interactive quadrant builds.
Keynote`s stock shapes lack strategic labeling; our BCG-specific diagrams embed axes, legends, and formulas, automating calculations for accuracy. Basic versions clutter with manual tweaks; ours offer one-click resizes and exports, slashing errors by 50%.
Layered for depth: Add trend arrows or scenario sliders absent in defaults, enabling forward-looking insights. Executives praise the 38% faster strategy sessions.
Define axes clearly - market growth vertical, relative share horizontal - with logarithmic scales for nuance. Color quadrants distinctly: greens for stars, reds for dogs. Update quarterly to track migrations.
Pair with narratives: Discuss implications per quadrant, fostering debate. This method, aligned with BCG methodology, sharpens decision velocity.
Picture a pharma giant reallocating from mature cash cows to biotech question marks, visualized in a before-after matrix duo. Or a retailer pruning dog categories, freeing capital for e-commerce stars.
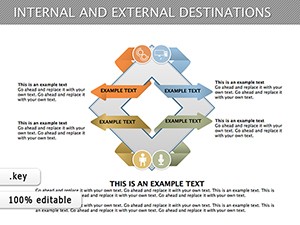
For global ops, segment by region in stacked matrices, revealing localized dynamics. Strategists report 32% improved allocation confidence.
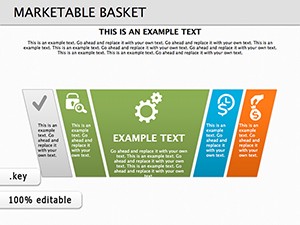
Innovate with hybrids: Fuse BCG with SWOT bubbles within quadrants for holistic views.
Position for prosperity. Acquire BCG Matrix Keynote diagrams today and steer your strategy supremely.
These diagrams demystify markets, turning analysis into advantage for enduring enterprise edge.
Copyright © 2009-2026 ImagineLayout All rights reserved.