Simplify complex concepts with our PowerPoint diagram templates, tailored to map out processes, structures, and relationships with visual elegance. Geared toward project managers, consultants, and trainers seeking to clarify without complexity.
Explore flowchart, org chart, and cycle designs that leverage SmartArt enhancements for scalability and interactivity. Each template includes editable connectors and shapes, ensuring adaptability to your specific scenario.
Boost comprehension in meetings or reports by deploying these tools that turn abstract ideas into concrete visuals. Compatible with all recent PowerPoint versions for hassle-free use.
Scan our diagram lineup and diagram your path to success!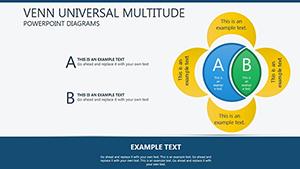
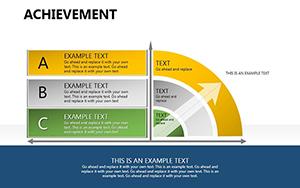
Diagrams distill information, making the intricate intuitive. Our templates surpass built-ins by offering thematic variants - like industrial gears for manufacturing or neural networks for AI - enhancing relevance and retention.
Consultants diagram client journeys with swimlanes, HR pros outline org charts with photo placeholders, and engineers sketch system architectures with layered nodes.
They excel with auto-alignment features, reducing manual tweaks and ensuring professional alignment every time.
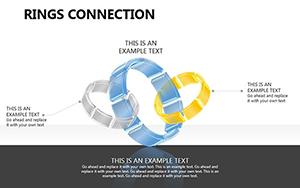
Click to reshape, recolor paths, or add hyperlinks to nodes. Animate sequences to reveal logic progressively, building suspense in your reveal.
For instance, a logistics firm used our pipeline diagram to trace supply chains, identifying efficiencies that saved 15% in costs.
Visualize better - acquire a diagram template and connect the dots.
Tom`s consulting deck with cycle diagrams clarified merger impacts, sealing the deal. Nina`s educational flowchart demystified biology processes, aiding student mastery.
From legal timelines to marketing funnels, versatility abounds.
Sync with Visio for depth, preview in presenter view, and collaborate via OneDrive. Robust testing guarantees cross-platform fidelity.
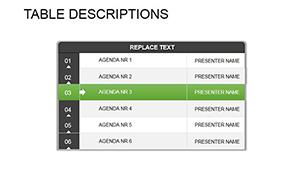
Flowcharts, pyramids, matrices, and more - suited to various narratives.
Yes, entrance and emphasis effects are preset for smooth playback.
All elements are scalable vectors for sharp prints and zooms.
Drag from libraries or upload SVGs for seamless fitting.
Absolutely - link nodes to slides, files, or web pages.
Share via cloud for real-time edits with teams.
Diagrams done right drive results. Get your PowerPoint diagram template today.
Copyright © 2009-2026 ImagineLayout All rights reserved.