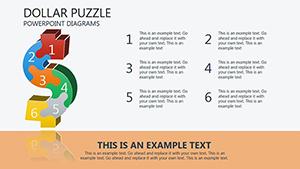
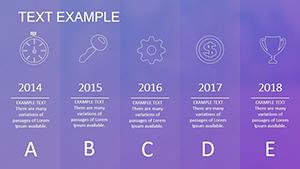
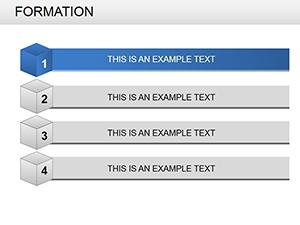
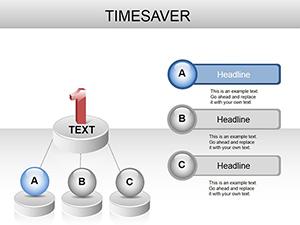
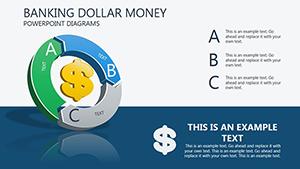
Illuminate financial narratives through our banking PowerPoint diagram templates, ideal for analysts crafting balance sheet breakdowns or strategy maps. These pre-built visuals - flowcharts, org charts, Sankey diagrams - accelerate insight delivery in boardrooms and client meetings.
Themes evoke stability with metallic tones and precise lines, ensuring diagrams integrate fluidly into decks. Scalable vectors maintain sharpness across slide sizes.
From risk matrices to process flows, empower decisions with at-a-glance clarity. Scan the options, download, and embed into your presentations for immediate impact.

PowerPoint diagrams in banking clarify complexities. Risk managers illustrate exposure funnels, tracing threats from identification to mitigation. Strategy teams map merger integrations with swimlane flows, assigning roles visually.
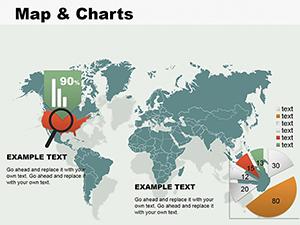
Compliance officers diagram regulatory workflows, highlighting bottlenecks for process tweaks. Traders use heat maps for portfolio volatility, spotting correlations instantly.
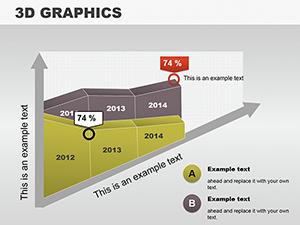
Quarterly earnings decks feature waterfall charts dissecting revenue streams.
Default shapes lack finance context, needing heavy customization. Ours arrive themed with ledger icons and formula links, trimming build time by 55%. Advanced connectors auto-route for clean layouts, avoiding the clutter of basics.
Animation paths reveal layers progressively, enhancing narrative depth.
Highlight: Interactive drill-downs where clicks expand sub-nodes, like branch hierarchies. Basel III compliant legends ensure audit readiness.
Export as SVGs for reports beyond PowerPoint.
Layer Sankeys with scenario sliders for what-if budgeting. Or gamify risk assessments with branching decision trees. These turn data into dialogues.
Download a lending flow template and diagram your pipeline - reveal efficiencies now.
Chart your path to clarity. Secure a banking diagram template and visualize success.
Copyright © 2009-2026 ImagineLayout All rights reserved.