Balance diagrams bring clarity to comparisons, decisions, and harmonious concepts in presentations. Our extensive PowerPoint collection offers versatile scale, equilibrium, and comparison visuals that help audiences understand relationships instantly.
Designed for impact and flexibility, these templates feature elegant scale icons, weighted elements, symmetrical layouts, and subtle animations that emphasize balance or imbalance effectively.
Ideal for strategy sessions, decision presentations, and conceptual explanations across industries.
Arrow Disintegration PowerPoint Diagrams Template: Elevate Your Presentations
ID: #PD00123
$24.00
(511)
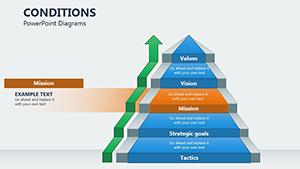
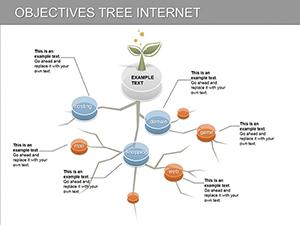
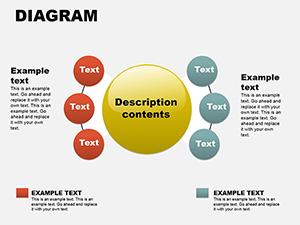
Dynamic Objectives Tree PowerPoint Diagrams: Elevate Your Presentations
ID: #PD00113
$20.00
(948)
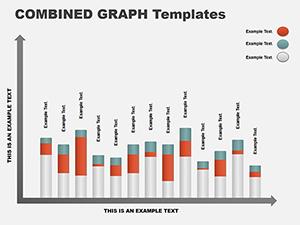
Column Graph PowerPoint Template for Financial Insights
ID: #PD00089
$10.00
(104)
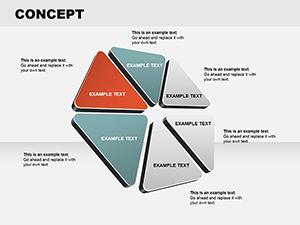
Flower Triangle Business Concept PPT Template
ID: #PD00087
$22.00
(196)
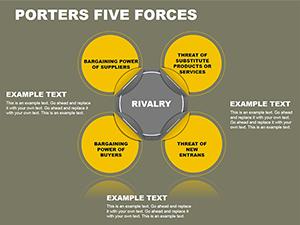
Porter's Five Forces PPT Template: Strategy Insights
ID: #PD00069
$18.00
(580)
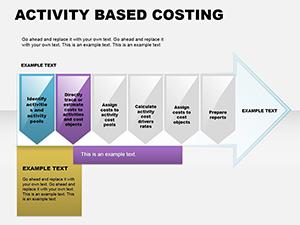
Activity Based Costing PowerPoint Template: Arrow Through Cost Complexities
ID: #PD00067
$12.00
(236)
Versatile Collection: PowerPoint Diagrams Pack
ID: #PD00056
$22.00
(882)
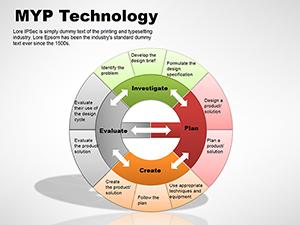
MYP Technology PowerPoint Diagrams Template
ID: #PD00048
$15.00
(114)
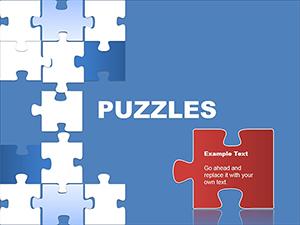
Blue Puzzle PowerPoint Diagrams: Assemble Insights That Fit
ID: #PD00047
$24.00
(92)
Cycle Diagrams for PowerPoint
ID: #PD00026
$28.00
Why Balance Diagrams Enhance Presentations
Visual metaphors of balance - scales, seesaws, symmetrical shapes - communicate complex trade-offs and equilibrium concepts far better than text alone. They make abstract ideas tangible and memorable.
Whether showing pros and cons, risk versus reward, or work-life harmony, balance diagrams create immediate understanding.
Our Varied Balance Diagram Collection
More than 100 unique templates cover diverse styles and use cases.
Classic scale and seesaw designs
Modern abstract equilibrium graphics
Pros/cons comparison layouts
Animated weighting effects
All fully editable in PowerPoint with-ready color schemes.
Common Applications
Strategic Decision Making
Weigh options, risks, and benefits in executive presentations and board meetings.
SWOT and Competitive Analysis
Visually balance strengths against weaknesses or opportunities versus threats.
Personal Development and HR
Illustrate work-life balance, skill equilibrium, or team dynamics in training sessions.
Financial and Resource Allocation
Show budget balance, cost-benefit analysis, or resource distribution.
These diagrams help presenters guide audiences toward balanced conclusions.
Benefits Beyond Standard PowerPoint Shapes
Basic PowerPoint icons lack sophistication. Our templates provide layered, professional designs with depth effects, custom icons, coordinated colors, and animation timing that default shapes can't match.
Pre-built visual metaphors
Easy weight adjustment visuals
Branding integration
Dynamic animation options
Discover the right balance diagram for your message and download it today.
Design Tips for Effective Balance Diagrams
Key guidelines:
Use symmetry when showing equilibrium, asymmetry for imbalance.
Apply subtle color differences to highlight weighted sides.
Keep text concise on each side.
Animate elements to tip gradually for dramatic effect.
Pair with minimal background for focus.
Creative approach: Use multiple interconnected scales to show complex interrelated decisions.
Consider cultural interpretations of balance symbols for global audiences.