Background PowerPoint Charts

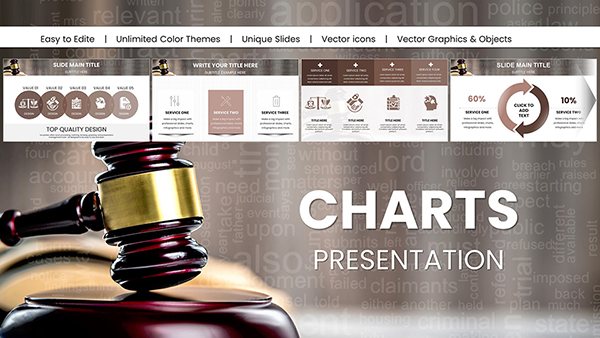
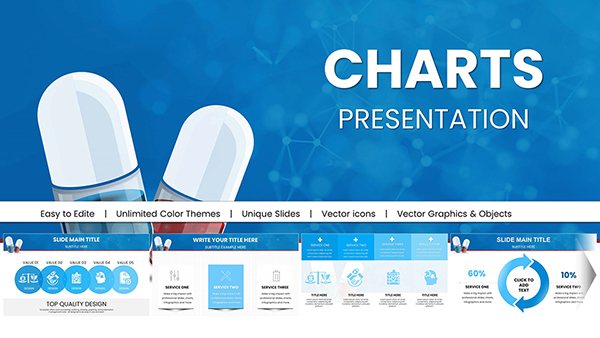
Supercharge your data storytelling in PowerPoint with chart-optimized backgrounds that frame graphs, bars, and pies with elegance and precision. These designs include subtle metrics-inspired patterns and neutral tones to let your data take center stage while adding subtle sophistication.

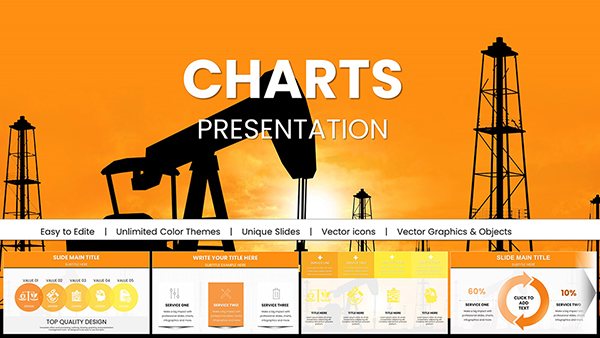
Data enthusiasts, executives, and analysts rely on these backgrounds to make numbers narrative, improving presentation outcomes in boardrooms and webinars. Fully tweakable, they fit any chart type and theme effortlessly.

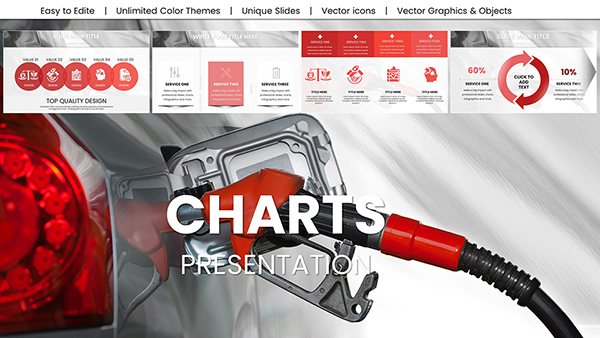
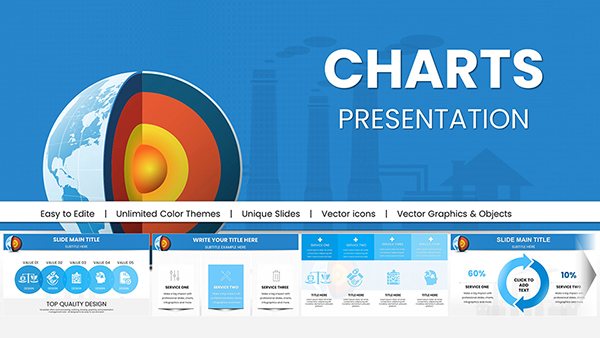
Scan our range for the perfect chart companion, and download to inject vitality into your visuals. Elevate your presentations starting now.


View by: Last Added | Most Popular
  • like 4
    (1006)
    Analytical Trend PowerPoint Charts: Decode Data with Precision
    ID: #PC01064
    $22.00
  • like 4
    (251)
    Presentations with Drone IT Technology PowerPoint Charts
    ID: #PC01052
    $25.00
  • like 4
    (811)
    Medical Health PowerPoint Charts Template
    ID: #PC01045
    $20.00
  • like 4
    (571)
    Virtual World Mask PowerPoint Charts: Futuristic Visions Unleashed
    ID: #PC01042
    $18.00
  • like 5
    (466)
    Medical Science PowerPoint Charts: Illuminating Health Data with Clarity
    ID: #PC01040
    $20.00
  • like 3
    (118)
    Marketing PowerPoint Charts: Fueling Strategic Storytelling
    ID: #PC01038
    $20.00
  • like 3
    (960)
    Comprehensive Legal Acts PowerPoint Charts for Professionals
    ID: #PC01033
    $25.00
  • like 4
    (837)
    Top Marketing Ideas: PowerPoint Charts for Strategic Wins
    ID: #PC01022
    $15.00
  • like 4
    (923)
    Oil and Gas Extraction PowerPoint Charts Template
    ID: #PC01007
    $22.00
  • like 5
    (123)
    Refuel a Car PowerPoint Charts - Download Editable Presentation Template
    ID: #PC00999
    $18.00
  • like 5
    (324)
    Healthcare PowerPoint Infographics: Master Medical Data Viz
    ID: #PC00978
    $18.00
  • like 3
    (730)
    Pill Pharmaceutical Medical PowerPoint Charts: Elevate Healthcare Insights
    ID: #PC00977
    $18.00
  • like 2
    (882)
    Geothermal Energy PowerPoint Charts: Fuel Sustainable Narratives
    ID: #PC00969
    $20.00
  • like 3
    (344)
    Exploring the Wonders of Our World - Planet Earth PowerPoint Charts
    ID: #PC00968
    $20.00
  • like 5
    (994)
    Analytical Pyramid PowerPoint Charts Template
    ID: #PC00845
    $22.00
  • like 5
    (652)
    4CS and 7PS Marketing Mix PowerPoint Charts Template
    ID: #PC00833
    $15.00
  • like 3
    (807)
    Dynamic Margin Analysis PowerPoint Charts: Unlock Business Insights with Precision
    ID: #PC00770
    $22.00
  • like 4
    (419)
    Marketing Mix Modeling PowerPoint Charts Template for Analysts
    ID: #PC00754
    $24.00
  • like 3
    (692)
    5-Level 3D Block Pyramid: Dynamic PowerPoint Charts for Impactful Storytelling
    ID: #PC00743
    $22.00
  • like 3
    (625)
    3D Matrix Puzzle PowerPoint Charts Template Pro
    ID: #PC00734
    $22.00
  • like 3
    (311)
    Time Management PowerPoint Charts Template
    ID: #PC00720
    $16.00
  • like 5
    (965)
    Protection, Economy, Market PowerPoint Charts Template: Navigate Market Dynamics
    ID: #PC00696
    $24.00
  • like 4
    (744)
    Pie Indicator World Economy PowerPoint Charts
    ID: #PC00687
    $18.00
  • like 3
    (309)
    Free Creative PowerPoint Chart Presentation Template for Matrices
    ID: #PC00622
    free


Chart Backgrounds: Elevating Data Beyond Defaults

Standard PowerPoint charts fade into monotony against blank slides. Our backgrounds add contextual depth - like waveform grids for trends - enhancing interpretability and aesthetic appeal, often doubling audience engagement.

A finance team employed ledger-pattern backgrounds for quarterly charts, streamlining approvals through intuitive visuals.

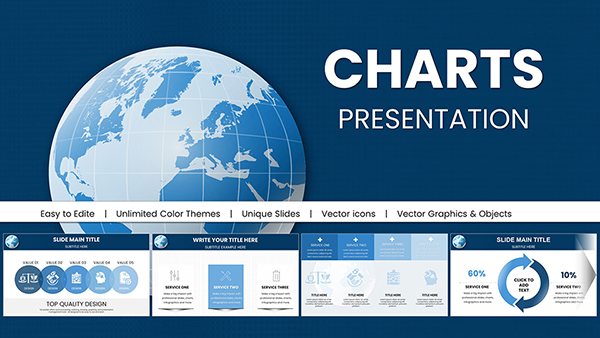
Targeted Uses for Chart Excellence

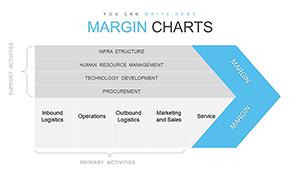
  • Financial Reports: Fiscal motifs for balance sheets.
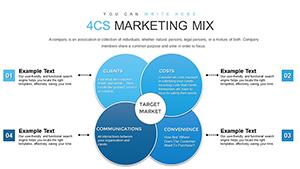
  • Marketing Analytics: Funnel shapes for conversion tracking.
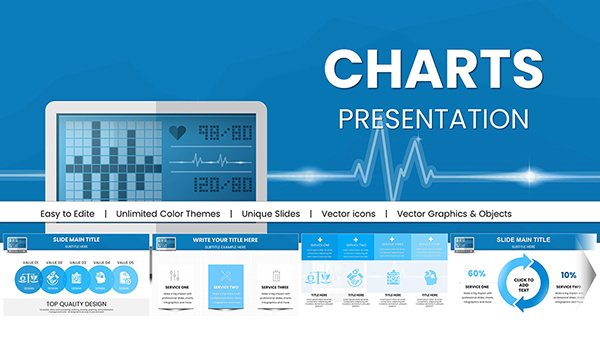
  • Health Metrics: Vital sign waves for wellness data.
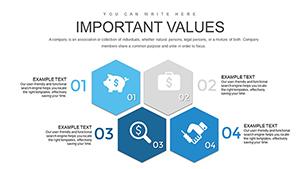
  • Sales Dashboards: Growth arrows for performance reviews.

They surpass basics with embedded guides for alignment, accelerating chart builds while ensuring visual harmony.

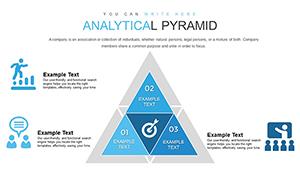
Expert Strategies for Chart Integration

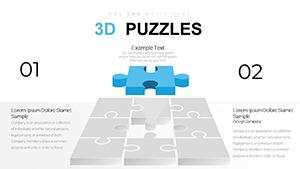
  1. Select relevance: Choose patterns echoing chart themes, like hexagons for scatter plots.
  2. Opacity control: Dial down to 20% for non-intrusive support.
  3. Data overlay test: Verify legibility with sample entries.
  4. Theme sync: Coordinate with overall deck palette.

In a startup pitch, bar chart backgrounds with upward trajectory lines captivated investors, securing funding. This underscores backgrounds` persuasive edge.

Drive Insights with Refined Visuals

High-DPI ready for projections, these backgrounds mesh with Excel imports, aiding sectors from retail to research.

Make your data unforgettable - browse and download chart backgrounds tailored for success.

Frequently Asked Questions