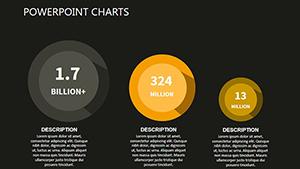
Bring your data stories alive with animated PowerPoint chart templates, crafted to add motion and energy to every slide. These designs feature fluid animations that reveal insights progressively, keeping audiences hooked from bar rises to line sweeps. Perfect for analysts, marketers, and educators who want to turn numbers into narratives.
Imagine quarterly results unfolding like a cinematic sequence - bars growing in sync with your explanation, or pie slices spinning to highlight market shares. Our templates are optimized for PowerPoint, with editable animations that adjust to your pacing. No more static graphs; these tools make complex datasets accessible and exciting.
Dive into our selection and elevate your next report or pitch. Instant downloads mean you`re set to impress right away.


Animated charts in PowerPoint go beyond visuals - they guide viewer attention, emphasizing trends and comparisons dynamically. Research shows animated elements can boost comprehension by 20%, as motion mimics real-world changes, like stock fluctuations or growth curves. Our templates harness this with pre-built sequences that sync seamlessly with your delivery.
Unlike basic charts that dump data at once, these reveal elements on cue, reducing overwhelm and building suspense. Ideal for sales demos where timing sells the story.
These keep files lightweight, ensuring glitch-free playback even on shared screens.
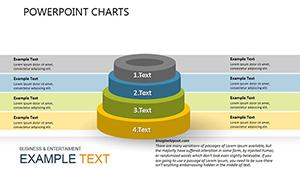
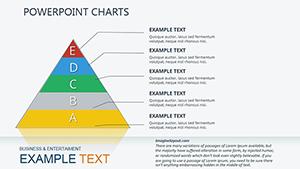
In marketing, animated funnel charts visualize customer journeys, with stages filling to show conversion rates - perfect for campaign reviews. Financial teams use line animations for revenue forecasts, drawing eyes along upward trajectories during board meetings.
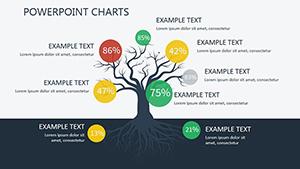
Educators animate scatter plots to demonstrate correlations in science lessons, making abstract concepts tangible. Startups pitch with growth charts that "build" investor confidence visually.
Static templates deliver info but lack drama; animated ones engage emotionally, turning data into drama. While defaults require manual animation tweaks that risk inconsistencies, ours come pre-rigged for reliability. Edit durations via PowerPoint`s timeline for precise control, a step up from trial-and-error in basics.
Performance-wise, they optimize for smooth exports to video, extending usability beyond live sessions.
Sequence animations logically - start with axes, then data, ending with labels. Use consistent speeds to avoid chaos, and test on varied hardware. Layer sounds sparingly for emphasis, like chimes on milestones.
Integrate with narratives: pause animations during key explanations to let points sink in.
A retail brand animates sales heatmaps, colors blooming to show seasonal hotspots, driving store layout discussions. Healthcare pros use pulse animations on vital sign graphs, simulating heartbeats for patient education.
Tech conferences feature radar charts spinning to compare features, wowing panels with 360-degree views.
Grab an animated template today and animate your success.
Elevate your data game - download animated PowerPoint chart templates now and watch engagement soar.
Copyright © 2009-2026 ImagineLayout All rights reserved.