Our extensive library of PowerPoint diagrams transforms ordinary slides into compelling visuals. From radial cycles to linear timelines these templates are fully editable and integrate seamlessly with your brand.
Real-World Use Cases
Business Reports: Present data-driven insights with clarity
Education: Visualize concepts for engaging lessons
Marketing: Map campaigns and strategies effectively
Benefits Over Default Templates
Pre-configured designs save time with auto-alignment scalable vectors and professional styling. Avoid generic slides and impress your audience effortlessly.
Creative Tips and Best Practices
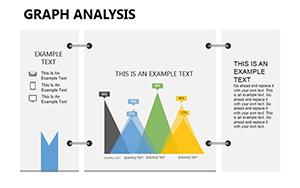
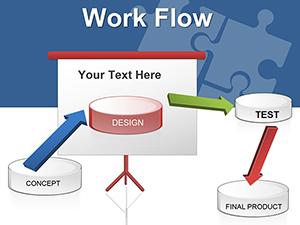
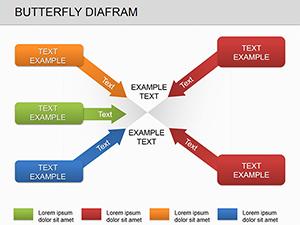
Choose diagram types that match your data: sequential for processes, comparative for contrasts
Use negative space to emphasize key points
Layer semi-transparent elements to create depth
Add hyperlinks for interactive decks
Explore templates like Strategy Cascade and Network Pulse to boost engagement and decision-making. Download and customize today.
Frequently Asked Questions
What diagram styles are available?
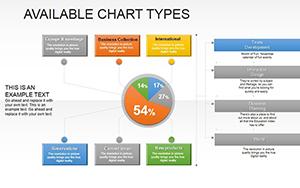
A range including flow radial hierarchical and comparative diagrams for diverse data narratives.
Do they work with PowerPoint animations?
Yes pre-set entrance and emphasis effects allow dynamic reveals seamlessly.
How customizable are the elements?
Fully editable resize recolor and reposition without disrupting layout integrity.
Why choose these over PowerPoint built-ins?
They offer ready-to-use complexity and professional styling saving time and effort.
Can diagrams be used in reports?
Yes export as images or vectors for Word PDF or print integration.