Transform abstract concepts into crystal-clear visuals using our specialized Keynote diagram templates. Designed for analysts, project managers, and presenters who need to convey intricate relationships and processes without overwhelming their audience.
These templates feature a variety of diagram types - from flowcharts and Venn diagrams to organizational charts - each optimized for Keynote`s powerful drawing tools. Say goodbye to clunky, hand-drawn sketches and hello to polished, scalable graphics that adapt to your content`s needs.
Ideal for strategy sessions, workflow explanations, or educational breakdowns, our diagrams boost comprehension and retention. With built-in color coding and animation paths, they add depth and dynamism to your slides, making even the most technical topics accessible and engaging.
Dive into our diagram collection today and visualize success with ease.
Diagrams are essential for breaking down complex information, and our Keynote templates take this to the next level with intuitive designs that integrate seamlessly into your workflow. In business, they illustrate supply chains or decision trees, helping teams align on objectives quickly. Educators use them to map historical events or scientific cycles, fostering deeper understanding among learners.
Unlike basic shapes in Keynote, our templates come pre-assembled with smart guides and editable connectors, reducing setup time dramatically. This allows you to focus on refining your narrative rather than wrestling with alignment issues. Users often note a 50% faster preparation process, freeing up energy for rehearsal and delivery.
Our templates outperform standard ones by including layered elements for easy modifications and export options for reports or infographics.
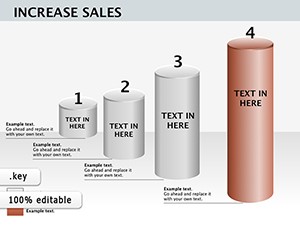
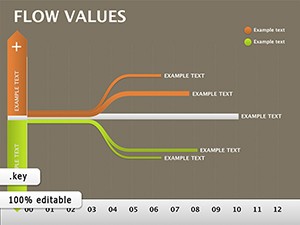
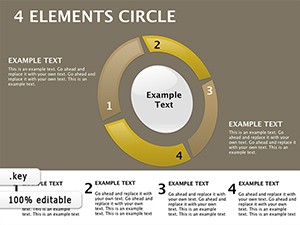
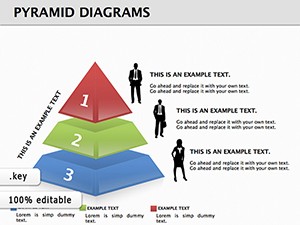
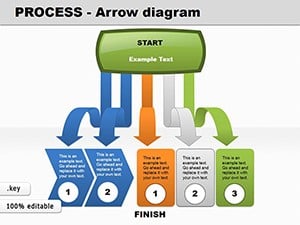
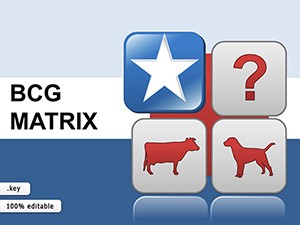
Begin with a clear objective: what story does your diagram tell? Choose from linear flows for sequential processes or radial designs for hierarchical structures. Apply consistent styling - limit colors to three for focus - and use labels sparingly to avoid clutter.
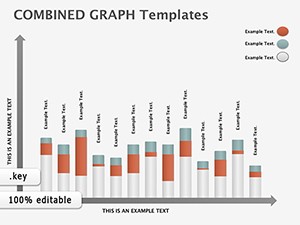
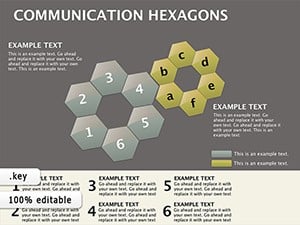
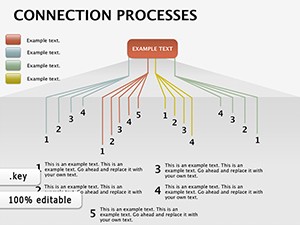
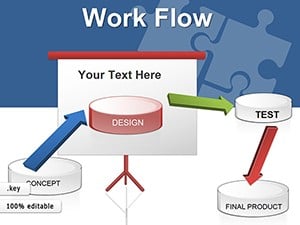
For example, the "Process Horizon" template uses horizontal bands to showcase multi-stage workflows, perfect for software development overviews. Clients in tech report clearer stakeholder buy-in after adopting this visual approach. Another gem, "Insight Nexus," employs interconnected nodes for relationship mapping, ideal for network analyses in consulting.
Enhancement Tip: Animate paths sequentially to reveal information progressively, building suspense and aiding comprehension.
Incorporate data-driven elements by linking diagrams to Keynote`s chart builder, auto-updating visuals as figures change. This is invaluable for live demos or iterative planning sessions. For accessibility, ensure high contrast and alt text for exported images.
Explore hybrid diagrams combining flows with icons for a more narrative feel, as seen in our "Journey Weaver" template, which has helped travel agencies visualize client experiences vividly.
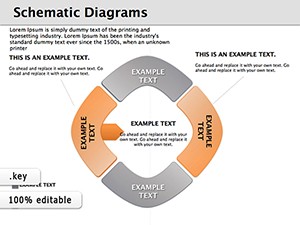
A logistics firm streamlined their supply chain explanations using our cycle diagram templates, resulting in a 30% reduction in meeting times. In academia, a biology instructor`s ecosystem diagrams via our radial templates increased student quiz scores by 20%.
These examples underscore the templates` adaptability for both small-scale reports and large-scale conferences. With vector-based scalability, they maintain sharpness across devices, from projectors to mobile screens.
Ready to clarify your message? Select a diagram template now and watch your presentations gain clarity.
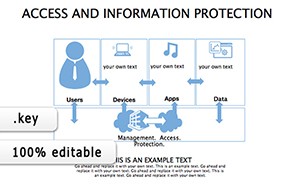
From flowcharts and org charts to mind maps and Venn diagrams, covering processes, hierarchies, and comparisons.
Yes, all templates support Keynote`s build-in animations for smooth, step-by-step reveals.
Fully - adjust elements individually while preserving proportions and alignment.
By simplifying complexity, they reduce cognitive load, making information more memorable and actionable.
Each template includes a quick-start guide with tips on customization and best uses.
Export as PDF, PNG, or SVG for use in reports, websites, or design software.
Copyright © 2009-2026 ImagineLayout All rights reserved.