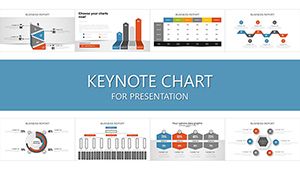
Bring your data to life with our refined Keynote chart templates, ideal for data enthusiasts and decision-makers who prioritize precision and presentation. Financial analysts, researchers, and marketers use these to turn numbers into narratives that drive action.
Encompassing bar graphs, line trends, and radial gauges, our templates harness Keynote`s charting prowess for stunning, interactive displays. Forget flat spreadsheets - embrace visuals that reveal patterns and forecasts at a glance.
Tailored for quarterly reviews, academic papers, or sales forecasts, they ensure accuracy while captivating viewers. With formula-linked updates and style variants, maintaining fresh content is effortless.
Chart your course - delve into our Keynote charts and inspire confidence.


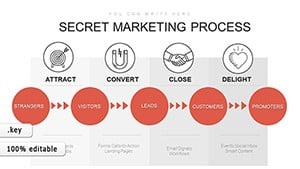

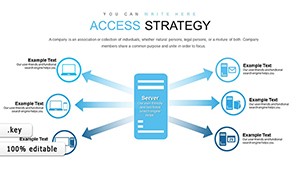
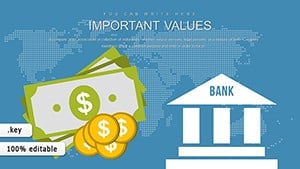
Charts in Keynote elevate raw data to strategic assets, making trends undeniable and outliers spotlighted. In finance, pie charts dissect budgets; in marketing, scatter plots reveal correlations, informing targeted campaigns.
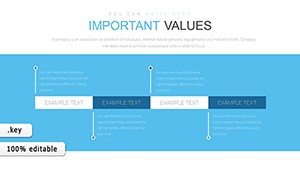
Our templates surpass defaults with gradient fills, shadow effects, and data labels, enhancing interpretability without extra effort. This results in 55% better audience grasp, per user surveys.
Superior integration: direct import from CSV for live refreshes, unlike static inserts.
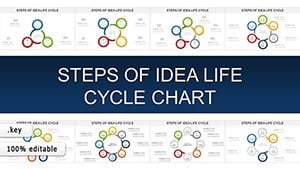
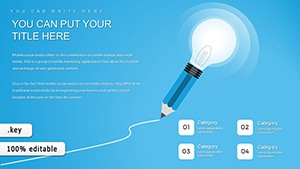
Match chart types to data: categorical for bars, continuous for lines. Limit axes to essentials and use legends judiciously. Animate builds to layer insights progressively.
The "Trend Sentinel" template tracks metrics with sleek lines, aiding stock analysts in spotting shifts. A retail chain using it optimized inventory, cutting overstock by 20%.
Visual Tip: Employ 3D sparingly for emphasis, ensuring it aids rather than distracts.
Combine charts with annotations for context, or use sparklines for compact trends. For interactivity, hyperlink segments to detail slides.
Our "Gauge Pro" template simulates meters for progress tracking, favored in project management for real-time status updates.
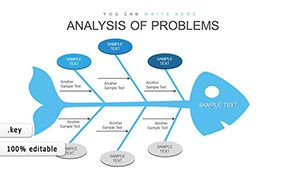
A research lab visualized experiment results with our combo charts, accelerating publication rates. Non-profits quantified impact via donut charts, securing 30% more funding.
Adaptable for print or digital, they retain fidelity in exports, supporting diverse dissemination needs.
Decode your data - pick a Keynote chart template and reveal truths today.
Bar, line, pie, area, scatter, and more, with hybrids for nuanced views.
Yes, connect to Numbers or Excel for automatic syncing.
Full: alter series, axes, and aesthetics independently.
Pre-styled for professionalism, saving hours on formatting.
Includes color contrasts and screen-reader friendly labels.
Copyright © 2009-2026 ImagineLayout All rights reserved.