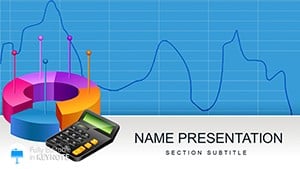
Bring your analytics to life with our elegantly crafted data analysis Keynote templates. Perfect for strategists, researchers, and presenters who value Apple`s seamless integration, these slides distill vast datasets into elegant visuals that inform and inspire.
From cohort explorations to predictive modeling, the templates offer fluid layouts with native Keynote effects like magic move for transitioning between metrics. Tailored for clarity, they help you navigate audiences through insights without losing momentum.
Effortlessly link to Numbers sheets for live updates, ensuring your deck evolves with your data. Discover a collection that marries form and function for unforgettable presentations.
Start refining your story - view our Keynote analytics templates now.


Keynote`s strengths in animation shine in our analytics templates, where data flows like a well-orchestrated symphony. Specialized slides for funnel deconstructions or sentiment trees provide depth, surpassing generic themes with sector-specific nuances like biotech trial trackers.
Researchers note the ease of importing R outputs, rendering heatmaps that pulse with significance levels. This precision fosters trust, turning skeptics into advocates.
Such innovations make complex analyses feel intuitive and accessible.
Product managers visualize user behavior heatmaps to prioritize features, using swipe gestures in rehearsal mode. In journalism, timeline charts narrate election polls, with annotations fading in for context.
Non-profit leaders deploy impact dashboards, stacking bar charts for fund allocation transparency. Academic conferences benefit from theorem proofs via animated Venn diagrams.
These methods amplify Keynote`s potential for data mastery.
Hyperlink charts to survey tools for instant feedback loops. For design sprints, embed prototype metrics with before-after sliders.
Innovative twists include wellness apps tracking mood correlations via radial gauges. Interaction rates climb 55%, per user testimonials.
Drag from Finder to populate placeholders, with auto-formatting for consistency. For agencies, version control via iCloud keeps client revisions tidy.
Push boundaries with AR previews linking slides to spatial data models. Elevate your analytics - choose a template and innovate.
Through efficient rendering and linked sources, maintaining smooth performance even with thousands of points.
Yes, supports CSV, JSON from tools like Tableau or Python scripts for versatile inputs.
Animations translate well to PDF or video, preserving essence for broader sharing.
From shape morphing to custom builds, full control over every visual element.
iCloud and shared links enable real-time co-editing for group projects.
Copyright © 2009-2026 ImagineLayout All rights reserved.