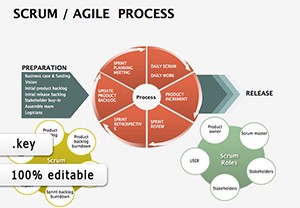
Bring your agile projects to life with our curated selection of Keynote diagrams. Tailored for Apple users who value sleek design and fluid animations, these templates make it simple to illustrate everything from daily scrums to long-term roadmaps. Ideal for creative professionals, tech innovators, and agile coaches, they turn data-heavy discussions into visually compelling narratives that resonate.
Each diagram boasts high-fidelity vectors, smooth transitions, and responsive layouts that shine on Retina displays. Whether mapping out user stories in a fishbone diagram or charting release cadences with a Gantt-style timeline, these tools empower you to communicate with precision and flair. Say goodbye to static slides; embrace animations that reveal insights progressively, keeping your audience hooked from slide one.
Targeted at teams in fast-paced environments like app development or design sprints, our diagrams promote better decision-making and foster a culture of continuous improvement. With effortless integration into Keynote`s ecosystem, you`ll spend less time formatting and more time strategizing. Browse our collection and elevate your presentations to inspire and unite your team today.
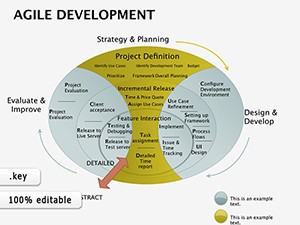
Keynote`s native strengths in animation and typography pair perfectly with our agile diagrams, creating slides that feel alive and intuitive. Diverging from basic shapes, these templates include advanced features like build-in effects for phased reveals, ideal for unveiling sprint goals step-by-step. In educational workshops, for example, a value stream mapping diagram can animate bottlenecks, helping learners visualize waste reduction in real-time.
For corporate use, these diagrams excel in executive briefings where clarity trumps complexity. A comparative advantage over default Keynote charts is our inclusion of thematic icons - think sprint cars racing toward milestones - which add a layer of memorability without sacrificing professionalism. Teams report up to 30% higher engagement when using animated visuals like these.
The unique edge lies in modularity: mix and match components, like combining a burndown with a risk matrix, to craft bespoke visuals. Best practices? Anchor animations to key transitions, use sans-serif fonts for readability, and export as videos for hybrid meetings - these tweaks ensure your message lands powerfully.
While standard Keynote templates offer versatility, they rarely capture agile`s iterative essence. Our diagrams bridge this gap with embedded hyperlinks for drill-down views and color-blind-friendly palettes, enhancing accessibility. A case in point: a marketing agency leveraged our planning poker diagram to facilitate remote estimation sessions, cutting meeting times in half.
Creatively, experiment with 3D rotations on cycle diagrams to simulate rotation in retrospectives, adding an immersive touch. Download a template now to see the difference firsthand.
These insights should spark your creativity. Peruse the gallery for inspiration tailored to your needs.
Copyright © 2009-2026 ImagineLayout All rights reserved.