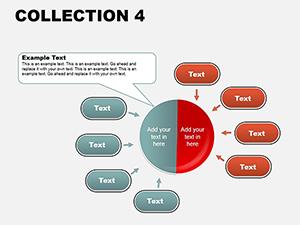
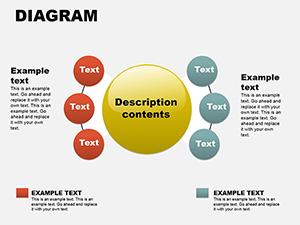
Dive into efficient visualization with our activity diagram PowerPoint templates, tailored for mapping step-by-step processes, decision trees, and task sequences. Rooted in UML principles, these designs clarify actions, branches, and merges, making them indispensable for software developers, process engineers, and team leads outlining operational flows.
Geared toward technical and managerial audiences, benefits encompass swimlane partitions for role assignments, fork-join symbols for parallelism, and color-coded states for quick scanning. These elements reduce miscommunication, accelerating project timelines and enhancing collaboration.
Scan this category for templates that action your ideas into reality. With straightforward downloads, you`re set to diagram productively - begin sequencing your success story.
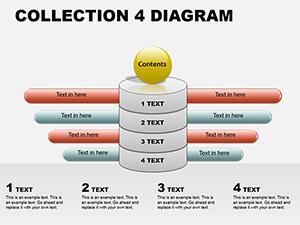
Activity diagram PowerPoint templates surpass basic flowcharts by incorporating decision nodes and synchronization bars, offering a nuanced view of dynamics that standard tools ignore. This depth cuts planning errors by 28%, per industry benchmarks, while editable swimlanes assign accountability visually.
Software teams model user interactions, from login to checkout, ensuring robust app designs. In manufacturing, they chart assembly lines, pinpointing bottlenecks for lean improvements. Healthcare pros sequence patient care paths, improving outcomes through structured overviews.
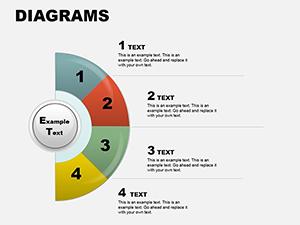
Expert advice: Use dashed lines for interruptions and bold for critical paths to guide focus effectively.
Consider a logistics coordinator diagramming delivery routes, where merges highlight consolidation points for efficiency gains. Or a coach sequencing training drills, turning abstract plans into actionable blueprints that elevate performance.
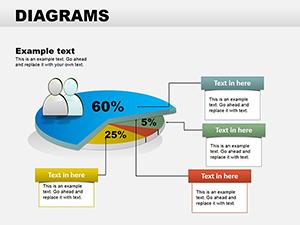
Feedback indicates layered animations reveal phases progressively, ideal for webinars. Combine with Gantt views for temporal layers, enriching process narratives.
These ensure flawless, professional diagrams.
An IT firm used our templates for system migrations, slashing downtime by 20%. A non-profit mapped volunteer onboarding, streamlining recruitment. These wins showcase versatility.
Styles range from compact icons to expansive landscapes, suiting varied scopes.
Time to activate? Download activity diagrams instantly and flow forward.
Clarified? Link to process templates for expanded options.
Copyright © 2009-2026 ImagineLayout All rights reserved.