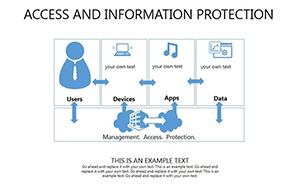
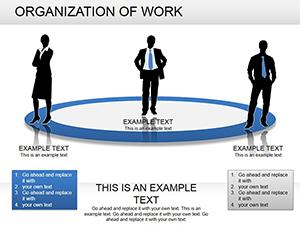
Clarify complex ledgers with our accounting PowerPoint diagram templates, developed for accountants, auditors, and finance teams decoding fiscal intricacies. These slides employ intuitive flowcharts, hierarchical org charts, and process maps to demystify transactions, reconciliations, and compliance workflows.
Essential for tax season briefings, internal audits, or stakeholder updates, they distill voluminous data into digestible diagrams that foster understanding and trust. With vector-based scalability and preset color schemes denoting debits/credits, adaptation is straightforward, keeping the spotlight on analysis.
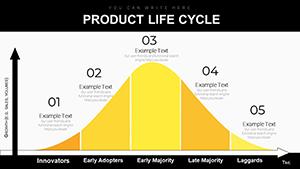
From payroll pyramids to revenue waterfalls, select from proven layouts that align with GAAP standards. Enhance your reporting arsenal today and illuminate financial truths.

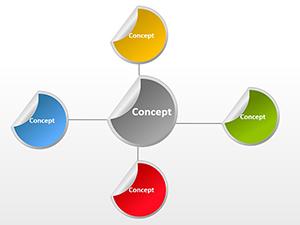
Diagrams in PowerPoint bridge numbers and narratives, vital for accounting`s precision demands. Our templates aid in visualizing cash flow cycles for CFO dashboards or expense categorization trees for budget committees, revealing efficiencies at a glance.
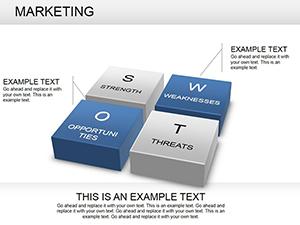
Forensic accountants map fraud detection paths with decision diamonds, strengthening case presentations. Tax preparers use bracket flowcharts to guide clients through deductions seamlessly.
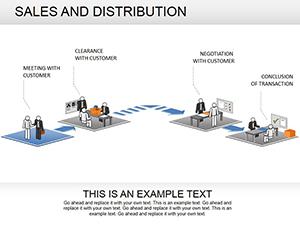
Bookkeeping firms deploy vendor payment funnels, optimizing AP processes. In mergers, due diligence diagrams outline asset valuations, accelerating integrations.
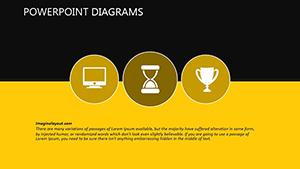
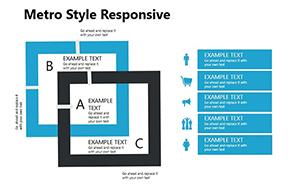
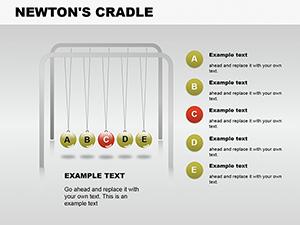
Basic PowerPoint shapes yield rigid, unthemed visuals prone to misalignment. Ours offer pre-linked nodes for effortless expansions, thematic icons like ledgers and calculators, and animation paths that simulate transaction flows, boosting retention in training sessions.
Accessibility-compliant with screen-reader tags and high-contrast options, they surpass standards for diverse audiences. Modular builds allow phased reveals, ideal for layered audits without overwhelming viewers.
Input data via connected tables, recolor via master slides, and animate with one-click presets - focusing energy on interpretive value.
Anchor diagrams to core questions: what flows where, why it matters. Employ consistent scales for comparability across periods, and annotate with callouts for exceptions. Collaborate via shared links for peer reviews, ensuring accuracy.
For board decks, condense to essentials; for deep dives, expand with drill-downs. Update quarterly to reflect policy shifts, maintaining relevance.
Decode finances fluidly - choose a diagram template and craft revelations that resonate.
An accounting firm streamlined SOX compliance with our process maps, cutting review times by 35%. In nonprofits, grant tracking Sankey diagrams visualized fund stewardship, impressing donors.
Startups used burn rate funnels to pitch sustainability to VCs, securing rounds. These cases highlight diagrams` role in persuasive accounting.
Extend with 3D rotations for volumetric data or hyperlinks to worksheets for interactivity, elevating static slides to dynamic tools.
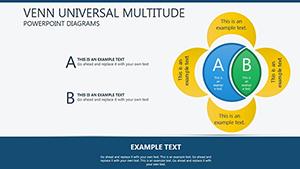
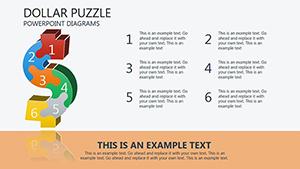
Org charts for asset/liability hierarchies and flows for equity movements.
Designed with standard classifications, customizable for IFRS too.
Yes, via Excel embeds for live refreshes.
Drag from libraries or upload SVGs for seamless integration.
Optimized for full-screen delivery with smooth transitions.
Includes alt text, logical tab orders, and color-blind modes.
Visualize accounting artistry - download now and diagram your path to fiscal clarity.
Copyright © 2009-2026 ImagineLayout All rights reserved.