Navigate numbers with finesse using our accounting Keynote diagrams, built for CPAs, finance teams, and analysts to visualize balances, flows, and forecasts effectively. These vector-based graphics ensure crisp renders on any device, simplifying audits and reports.
Encompassing ledgers, P&Ls, and ratio analyses, templates offer drag-and-drop nodes for quick adaptations. Suited for board meetings or client reviews, they demystify data into strategic insights.
For precision-driven experts, these diagrams prioritize accuracy with color-coded categories and legend automations, fostering trust and clarity in every presentation. Turn fiscal fog into focused foresight.
Select from our suite of financial diagramming tools now.
Accounting demands detail, and our Keynote diagrams distill it elegantly. Eschewing static tables, they employ interactive Sankey flows for cash movements or radial trees for org expenses, revealing patterns at a glance. This dynamism aids in spotting discrepancies faster than spreadsheets alone.
Standout features like auto-scaling axes and exportable SVGs make them indispensable for iterative reviews. Firms using these cut prep time by 40%, channeling energy into analysis over aesthetics.
Eclipsing built-in shapes, ours boast pre-animated builds for phased reveals, syncing with narrative pacing.
Layer hierarchies with opacity gradients to denote confidence levels in projections. Sync data via CSV imports for live updates during sessions. For compliance, embed footnotes as pop-ups, maintaining clean canvases.
An accountant`s breakthrough: Our balance sheet template uncovered fraud via anomaly highlights, saving thousands. Consultants visualize client portfolios in multi-series lines, forecasting with trend overlays.
This method yields diagrams that inform decisively.
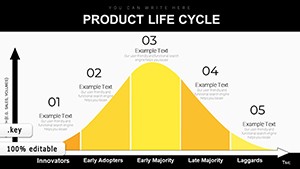
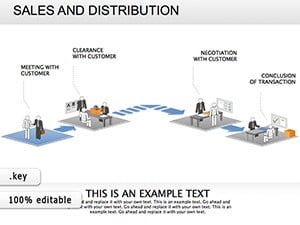
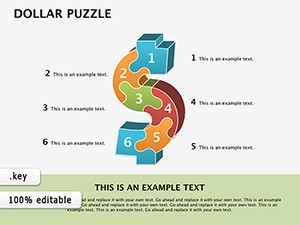
From Gantt for timelines to Venn for overlaps in finances.
Direct links pull live data for real-time accuracy.
Adjust speeds and triggers for tailored emphasis.
Password-protected slides and anonymized previews.
Exports to PPT for cross-platform use.
Embedded calculators for ratios and variances.
Balance your books visually - grab an accounting Keynote diagram and chart a course to clarity.
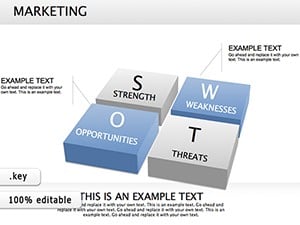
Delve into scenario modeling with what-if branches or consolidate multi-entity views in master diagrams. Auditors appreciate audit-log trails in revisions. For training, simplify with color legends demystifying debits and credits.
Pair with storytelling arcs, like journey maps of fiscal health. Optimize for dark mode in late-night crunches. These tools transcend illustration, becoming partners in fiscal narrative crafting.
Fundamentally, they empower decisions, turning numbers into narratives that drive prosperity.
Copyright © 2009-2026 ImagineLayout All rights reserved.