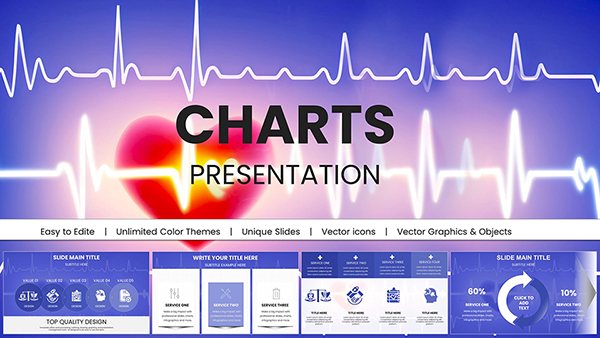
Creating presentations that everyone can access shouldn`t be a challenge - it`s a standard. Our accessible PowerPoint chart templates are crafted with inclusivity at their core, featuring high-contrast colors, logical data hierarchies, and alt text placeholders for screen readers. Perfect for educators, business analysts, and compliance officers, these templates transform raw numbers into compelling narratives without leaving anyone behind.
From bar graphs illustrating market trends to pie charts breaking down demographic insights, each design prioritizes readability and flow. Built on PowerPoint`s robust framework, they support animations that enhance understanding rather than distract, ensuring your message resonates across audiences, including those using assistive technologies.
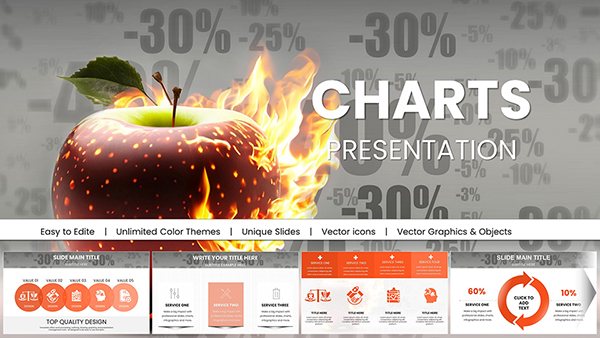
Benefits abound: save time on formatting, meet accessibility guidelines effortlessly, and boost engagement through intuitive visuals. Whether for corporate reports or classroom lessons, these templates empower you to deliver information equitably. Dive into our collection and design with confidence today.
In an era where diverse audiences demand equitable access, our PowerPoint chart templates rise above basic designs by embedding universal design principles from the start. They go beyond mere aesthetics, incorporating features like resizable elements, descriptive titles, and color-blind-friendly palettes - elements often absent in default PowerPoint charts that can alienate viewers.
For example, a line chart template for sales forecasting includes gridlines for precision and legends positioned for optimal scanning, reducing cognitive load for all users. This thoughtful approach not only complies with standards like WCAG but also enhances overall comprehension, leading to more effective presentations.
Versus standard charts, which might rely on flashy effects at the expense of usability, our templates emphasize substance - think simplified axes labels and consistent spacing that prevent visual clutter. The result? Presentations that inform and include, fostering deeper discussions and better decisions.
Begin with the slide master to unify your theme, then layer in data via linked Excel sheets for real-time updates. Opt for sans-serif fonts at 24pt minimum, and test with tools like PowerPoint`s built-in checker. For added flair, integrate subtle transitions that announce changes audibly.
A best practice: Always include a summary slide recapping key insights, reinforcing accessibility through reinforcement.
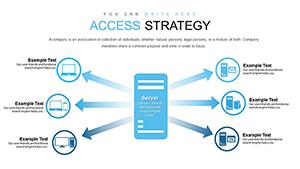
A non-profit used our radar chart template to map community needs, customizing spokes for priority areas and adding voice-over notes for virtual delivery. The outcome? Increased donor engagement by 25%, as the inclusive format built trust.
In academia, professors adapted donut chart designs for survey results, embedding hyperlinks to raw data sources. Creatively, combine with shapes for hybrid visuals, like overlaying icons on bars to denote categories intuitively.
Unlock inclusive design - select and download an accessible chart template now to elevate your next presentation.
They include pre-set alt text for charts and structured titles, making elements navigable via tools like JAWS or NVDA.
Yes, optimized for responsive viewing, they adapt seamlessly to tablets and phones without losing detail.
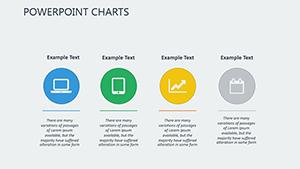
Our library covers bars, lines, pies, and more, all with accessibility tweaks for versatile data display.
Absolutely - link to external sources like Excel for effortless refreshes during live sessions.
Every template features patterns and textures alongside colors for full-spectrum accessibility.
Use subtle builds with pause controls, announced by screen readers for timed reveals.
Copyright © 2009-2026 ImagineLayout All rights reserved.