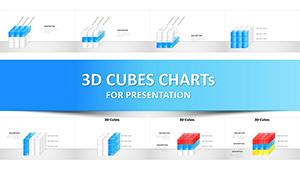
Transform your presentations with our comprehensive collection of 3D cube chart templates designed specifically for PowerPoint and Google Slides. These professionally crafted templates bring depth and visual impact to your data presentations, making complex information instantly understandable.
Whether you're presenting business strategies, project timelines, organizational structures, or analytical frameworks, 3D cube designs add a modern, dimensional quality that captures attention and enhances comprehension. Each template is fully customizable - adjust colors, sizes, rotations, and text to match your brand identity and presentation needs.
Our 3D cube charts are perfect for business professionals, educators, consultants, and anyone who needs to communicate multi-faceted concepts clearly. Download instantly and start creating presentations that stand out with professional geometric designs that your audience will remember.


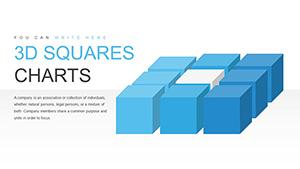

Three-dimensional cube charts have become essential tools for modern presenters who need to visualize complex relationships and hierarchies. Unlike flat diagrams, 3D cube templates provide depth perception that helps audiences understand layered information, interconnected processes, and multi-dimensional data structures. These templates transform standard presentations into memorable visual experiences.
The power of 3D cube designs lies in their versatility. Business analysts use them to display market segmentation and competitive positioning. Project managers employ cube diagrams to illustrate project phases, resource allocation, and task dependencies. Marketing teams leverage these designs to present product features, customer journey stages, and campaign components. Educational institutions utilize cube charts for teaching mathematical concepts, scientific principles, and organizational theory.
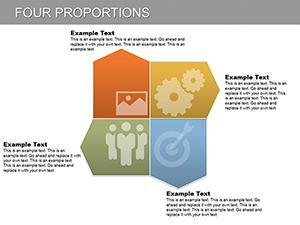
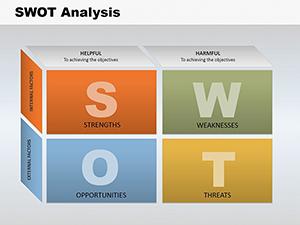
Business Strategy & Planning: 3D cube templates excel at presenting strategic frameworks. Use them to showcase business model components, strategic pillars, or departmental structures. The geometric nature of cubes makes them ideal for displaying balanced scorecards, where each face represents a different performance dimension - financial, customer, internal processes, and learning & growth.
Data Visualization & Analytics: When presenting complex datasets, 3D cube charts help break down information into digestible segments. Create visual representations of data cubes for OLAP analysis, display multi-variable comparisons, or illustrate hierarchical data structures. The three-dimensional aspect allows presenters to show relationships that would be difficult to convey in two-dimensional charts.
Project Management: Project timelines, milestones, and deliverables come to life with cube-based diagrams. Stack cubes vertically to show project phases or arrange them in matrix formations to display resource allocation across multiple initiatives. Color-coding different cube faces helps distinguish between teams, priorities, or completion status.
Educational Presentations: Teachers and trainers use 3D cube templates to explain abstract concepts in mathematics, science, and technology. Demonstrate spatial relationships, illustrate molecular structures, or teach geometric principles. The tangible nature of cube shapes helps students grasp complex ideas more easily than abstract diagrams.
Our 3D cube chart templates incorporate professional design elements that ensure your presentations maintain visual consistency while delivering maximum impact. Each template includes editable components that allow complete customization without requiring advanced design skills.
Rotation & Perspective Control: PowerPoint's built-in 3D format tools enable you to adjust cube orientation, depth, and viewing angle. This flexibility ensures your diagrams align perfectly with your narrative flow. Rotate cubes to emphasize specific faces, adjust depth perception for dramatic effect, or create isometric views for technical presentations.
Color & Texture Options: Apply gradient fills, solid colors, or textured surfaces to differentiate cube elements. Use your corporate color palette to maintain brand consistency, or choose contrasting colors to highlight key information. Transparency settings allow you to show overlapping elements or create layered compositions.
Animation Capabilities: Bring your 3D cubes to life with PowerPoint animations. Use "Arrive" effects to introduce cubes one by one, "Jump & Turn" animations to rotate cubes and reveal different faces, or "Fade" transitions to shift focus between elements. Well-timed animations guide audience attention and reinforce your message progression.
Successful presentations using 3D cube charts follow proven design principles. Start with clear hierarchy - ensure your most important information occupies the most prominent cube positions. Use size variations to indicate priority or importance, with larger cubes representing primary concepts and smaller cubes showing supporting details.
Maintain visual balance by distributing elements evenly across your slide. Avoid overcrowding - 3D elements need breathing room to maintain their dimensional quality. White space around cube clusters enhances focus and prevents visual confusion. Limit the number of cubes per slide to 8-10 maximum for optimal comprehension.
Text placement matters significantly in 3D cube designs. Position labels on cube faces for direct association, use connector lines for complex relationships, or place text alongside cubes for cleaner compositions. Ensure text remains readable by avoiding overly busy backgrounds and maintaining sufficient contrast ratios.
While traditional 2D charts like bar graphs and pie charts serve specific purposes, 3D cube templates offer distinct advantages for certain presentation scenarios. Standard charts excel at showing numerical trends and comparisons, but cube diagrams shine when presenting structural relationships, spatial concepts, or multi-layered information.
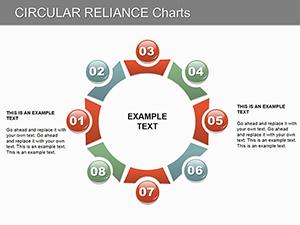
Consider using 3D cubes instead of standard organizational charts when you need to show cross-functional relationships. Replace traditional process flows with cube-based diagrams when presenting cyclical or interconnected workflows. Substitute matrix diagrams with cube arrangements when demonstrating three or more variables simultaneously.
The dimensional aspect of cube charts engages visual processing differently than flat graphics, making them particularly effective for audiences with varying learning styles. Kinesthetic learners respond well to the tangible quality of 3D shapes, while visual learners appreciate the spatial relationships cube diagrams provide.
To achieve professional results with 3D cube templates, follow these technical best practices. Always work with vector-based shapes rather than image files - this ensures your cubes remain crisp at any size and won't pixelate when projected on large screens. PowerPoint's native 3D format tools provide better quality than imported graphics.
Pay attention to lighting and shadow effects. Consistent light sources across all cubes create cohesive compositions. Use subtle shadows to enhance depth perception without overwhelming the design. Adjust contour and bevel settings to refine cube edges and surfaces - small adjustments can dramatically improve visual appeal.
For presentations that will be printed, consider reducing 3D effects slightly. While screen presentations benefit from pronounced depth, printed materials often look cleaner with more subtle dimensional effects. Test your slides in both formats to ensure optimal appearance across all delivery methods.
Copyright © 2009-2026 ImagineLayout All rights reserved.