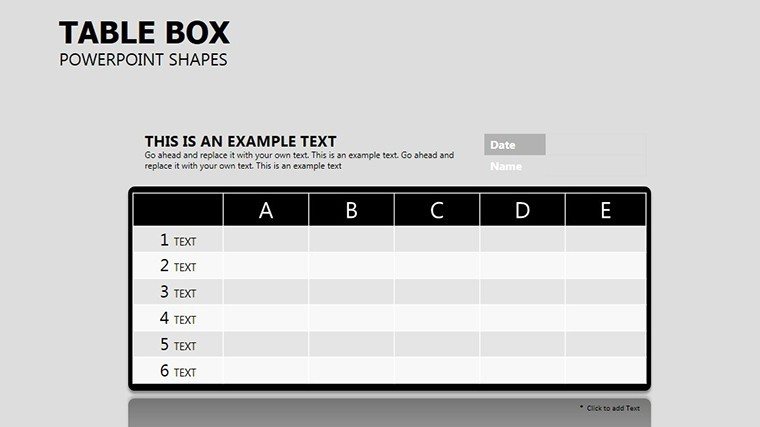
Table Box PowerPoint Shapes: Structuring Data into Visual Symphonies


Type: PowerPoint Shapes template
Category: Tables
Sources Available: .pptx
Product ID: PS00003
Template incl.: 25 editable slides
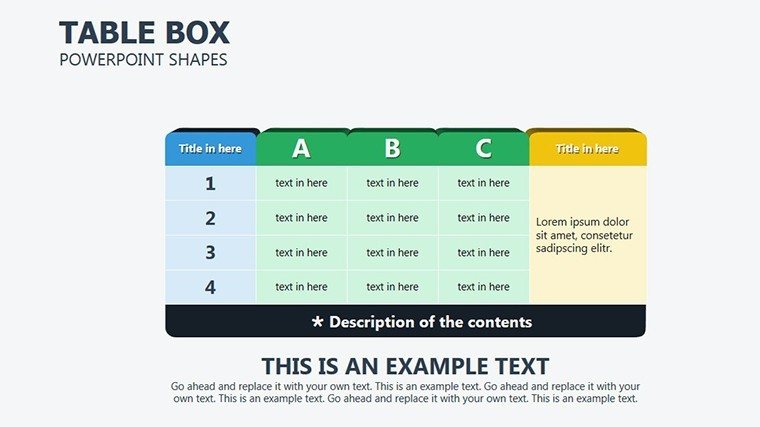
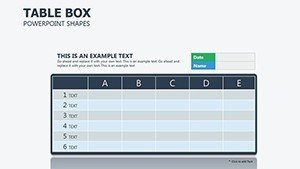
When tables threaten to tip into tedium, it's time for shapes that sculpt information into something sculptural. The Table Box PowerPoint Shapes template delivers 25 editable slides where boxes, borders, and icons redefine organization, turning spreadsheets into slideshow stars. Aimed at business analysts, teachers, and planners juggling agendas or timelines, it emphasizes hierarchy and intrigue through clever shape play.
Each slide leverages shapes to divide, highlight, and iconify - think borders framing KPIs or symbols denoting priorities. In .pptx for PowerPoint 2010+, it's primed for quick customizations like resizing cells or tinting rows. Valued at $24, it pays off in hours saved on design drudgery. An operations lead applied its bordered tables to shift schedules, creating clarity that cut meeting times in half through visual shorthand.
Shaping the Foundation: Key Features That Frame Your Data
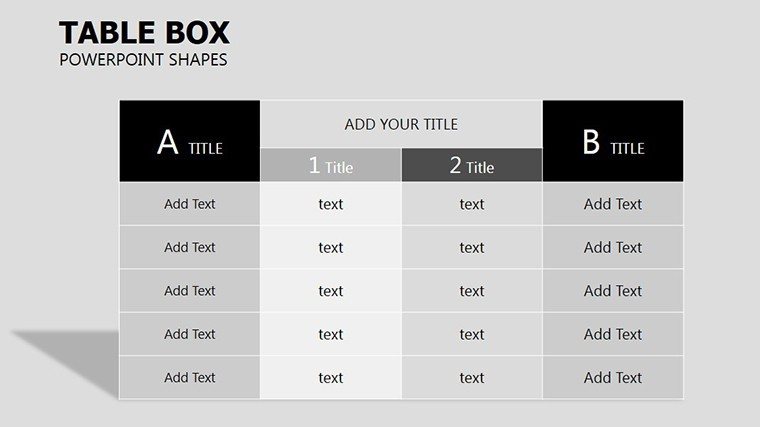
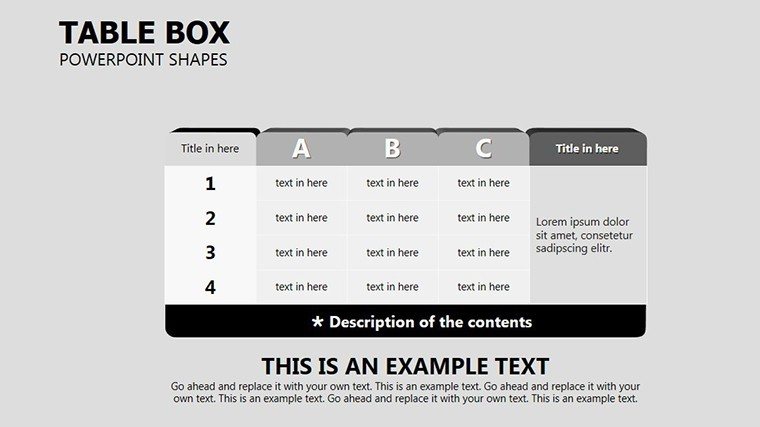
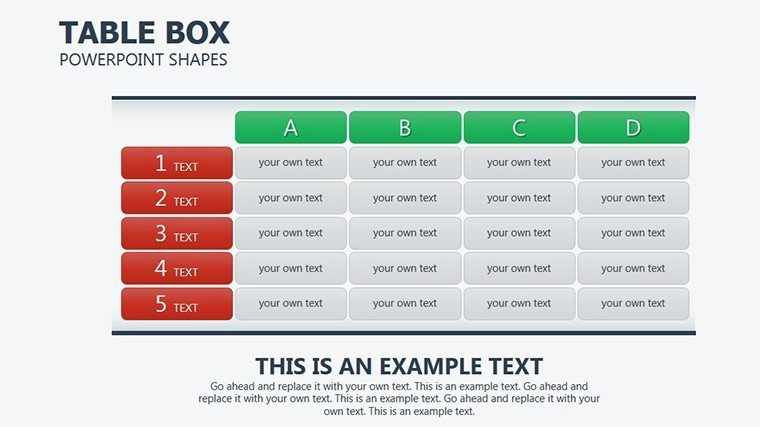
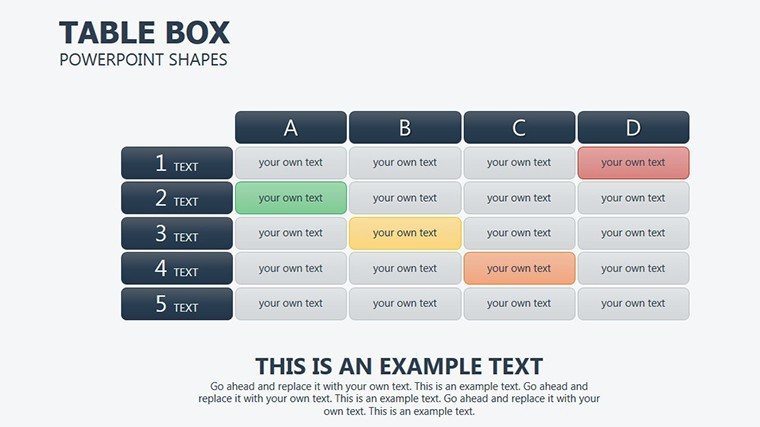
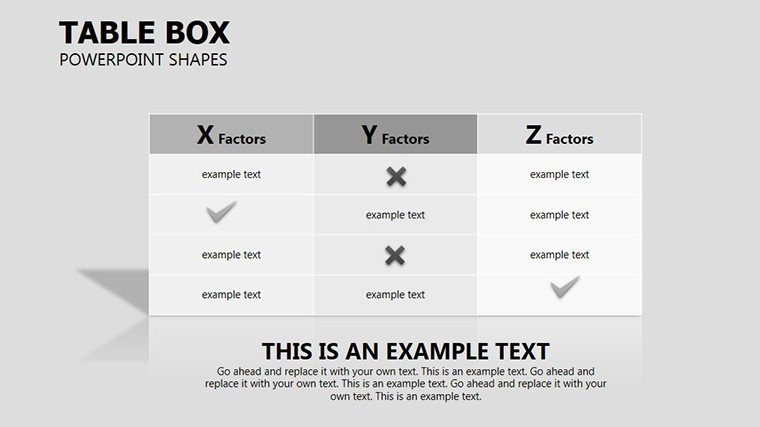
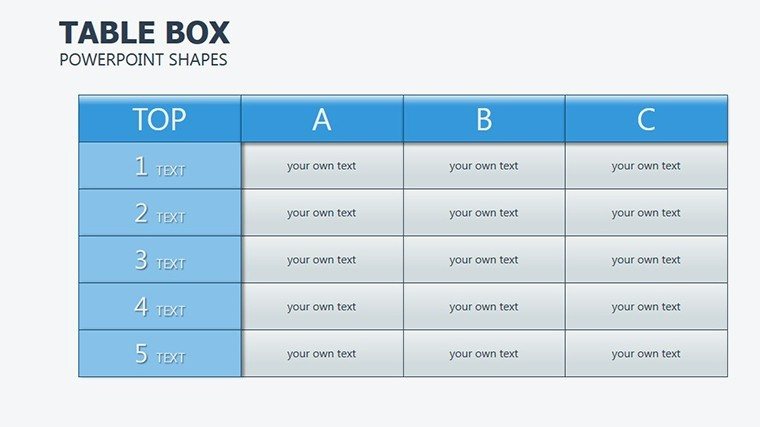
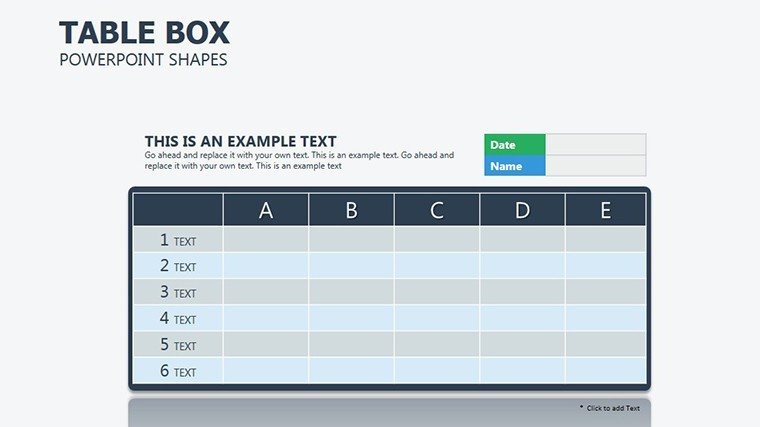
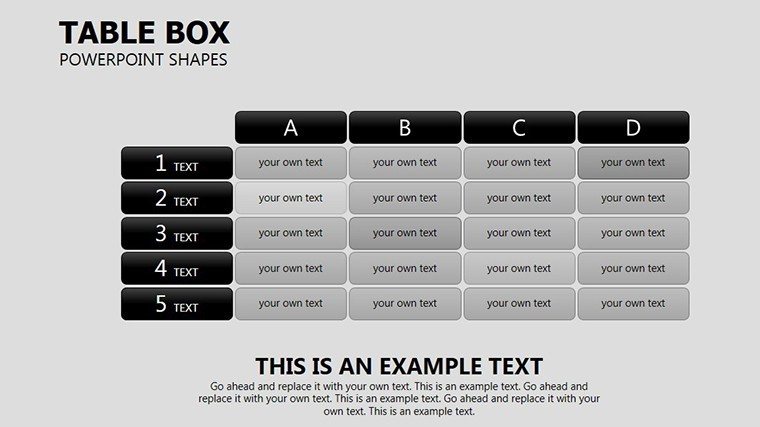
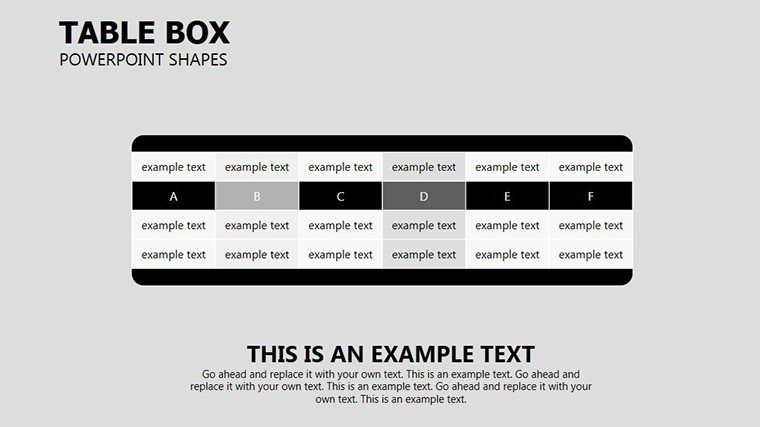
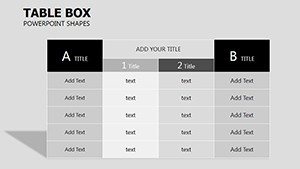
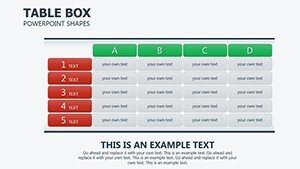
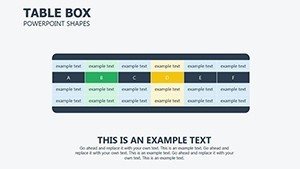
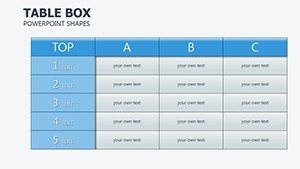
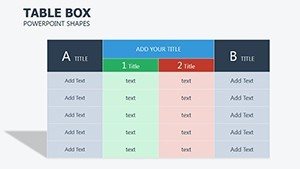
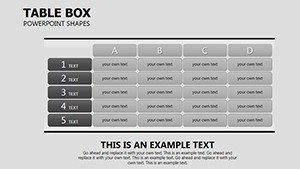
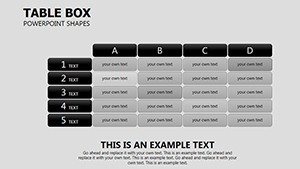
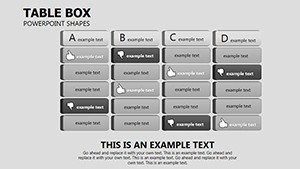
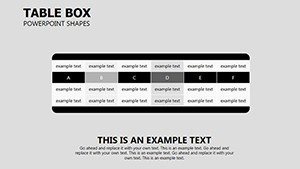
Slide 1 establishes a simple boxed grid, cells as rounded rectangles for contact lists - merge for headers spanning widths. Slide 2 elevates with shadowed boxes for depth in budget trackers, lifting totals above line items. Slide 3 incorporates divider shapes as wavy lines, segmenting quarterly reports into flowing narratives.
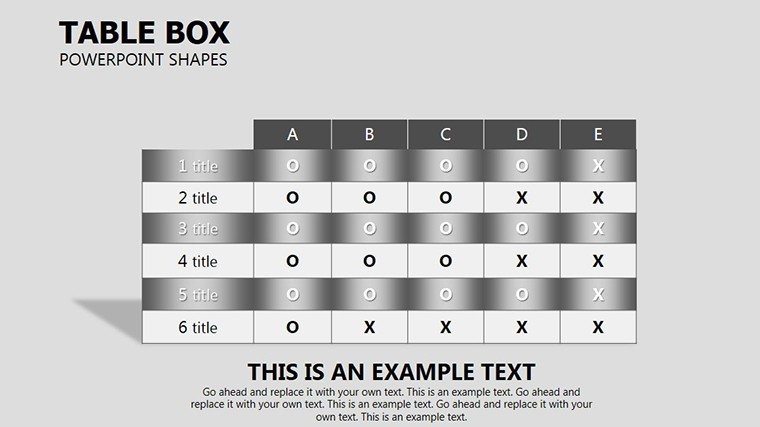
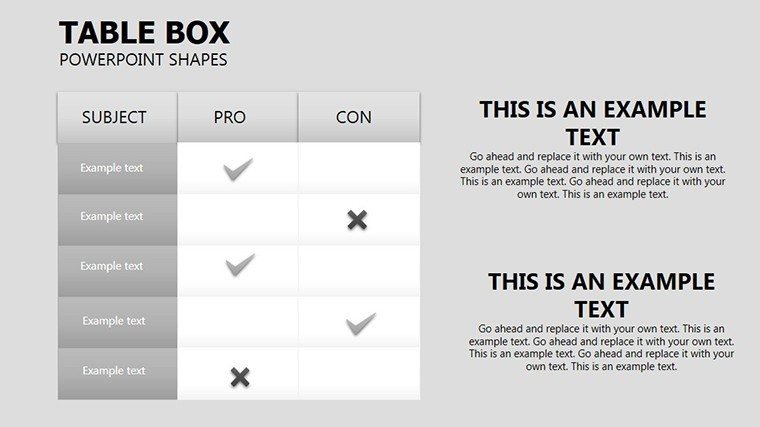
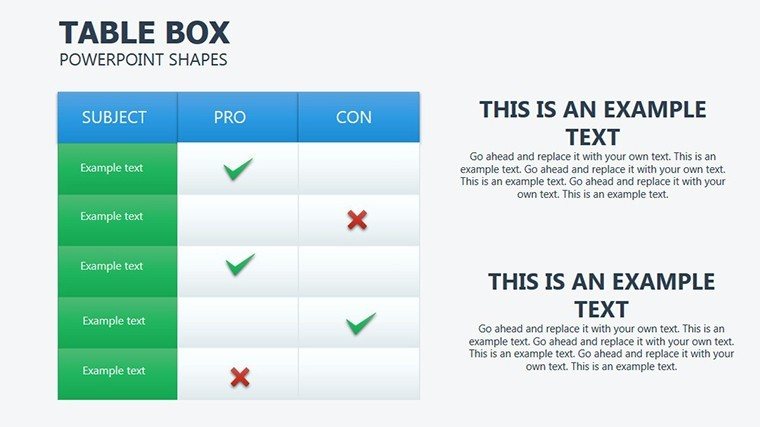
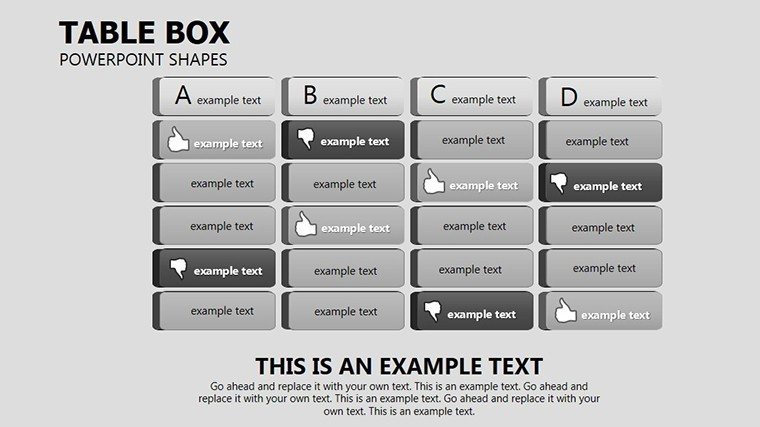
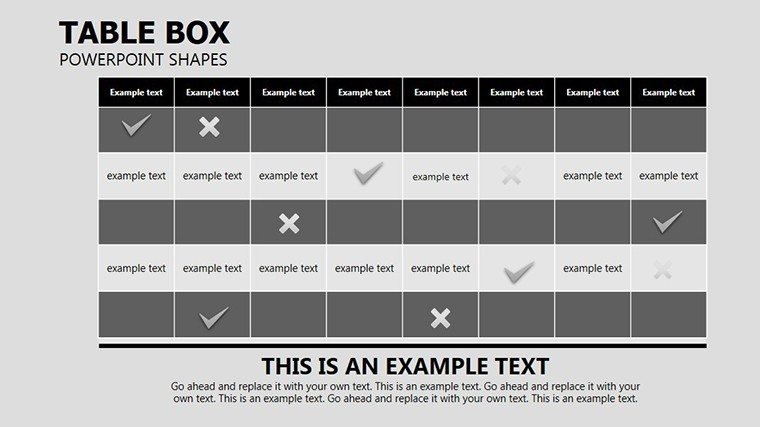
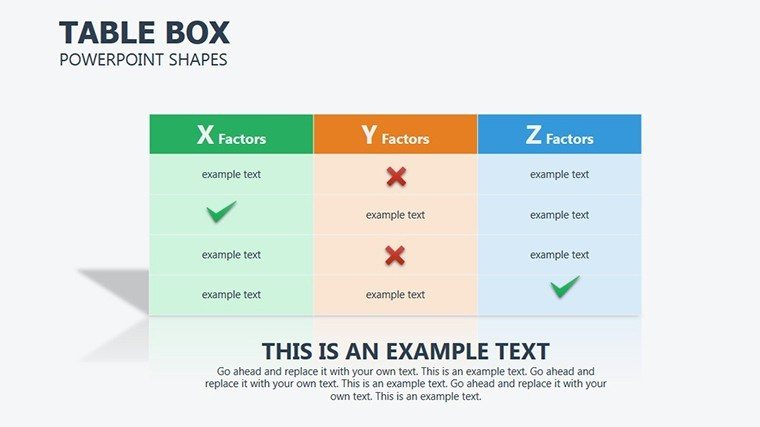
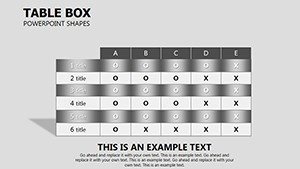
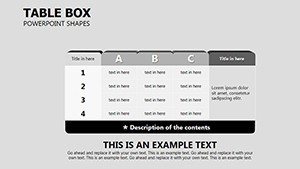
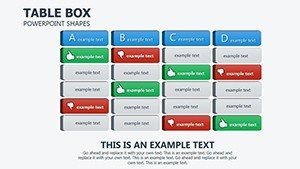
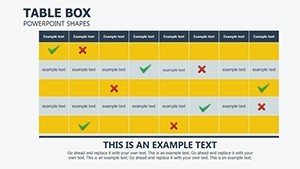
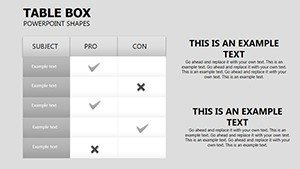
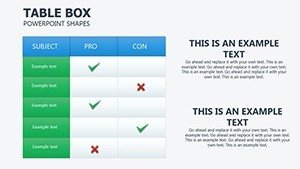
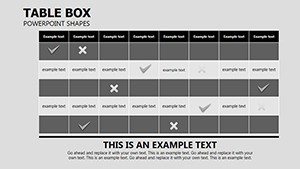
Slide 4 icons cells with check boxes for task matrices, clickable for interactive reviews. Slide 5 stacks cylindrical shapes into bar-like tables for progress visuals, filling heights by completion. Slide 6 weaves hexagonal boxes for collaborative mind-tables, interlocking for team dependencies. Slide 7 frames data with ornamental borders, suiting elegant agendas.
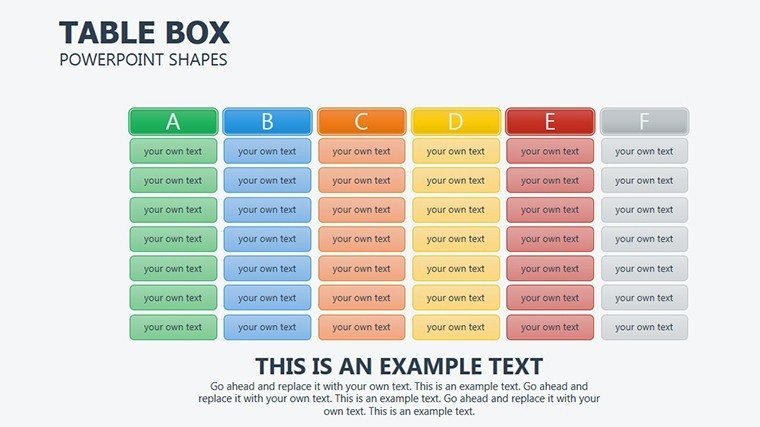
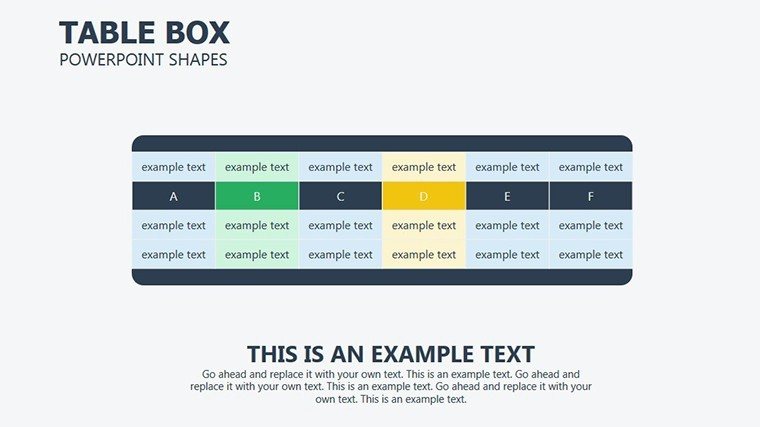
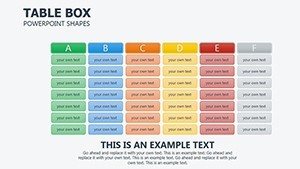
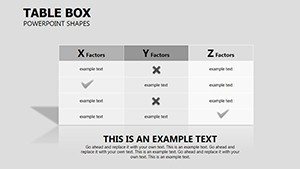
From Slide 8's nested boxes for subcategories in org charts to Slide 12's spiral-shaped timelines wrapping tabular events, variety abounds. Mid-pack, Slides 13-18 explore color-blocked shapes for heat maps, gradients signaling urgency. Later slides like 20's asymmetric boxes add asymmetry for creative inventories, while 24-25 culminate in dashboard fusions of all techniques.
- Visual Hierarchy Tools: Built-in emphasis via bold outlines and fills to guide scans.
- Icon Infusions: 40+ shape-compatible symbols for instant categorization.
- Flexible Scaling: Maintain proportions when expanding tables dynamically.
Beyond mere containment, these shapes instill order with artistry, easing the cognitive load in dense datasets.
Expert Tweaks: Refining Shapes for Maximum Impact
Access the drawing tools to convert tables to grouped shapes, unlocking advanced edits like perspective tilts. For cohesion, apply theme colors via the variants menu, ensuring accessibility with sufficient contrasts. Link external data sources to auto-populate box contents, keeping live updates fresh.
- Assess content volume - choose box densities to avoid clutter.
- Layer transparencies for overlays, revealing comparisons subtly.
- Validate with color-blind simulators for inclusive designs.
These refinements, rooted in UX principles, make your tables not just seen, but savored.
Practical Deployments: Shapes Serving Diverse Needs
Business folk harness Slide 4's check boxes for performance matrices, ticking achievements in real-time reviews. Teachers transform Slide 7's bordered agendas into lesson scaffolds, shapes as activity zones. Students plot Slide 5's bars for study trackers, visualizing streaks to motivate.
Individuals curate Slide 20's asymmetries for goal boards, boxing aspirations uniquely. In project management, Slide 6's hexagons link tasks interdependently, mirroring Gantt complexities simply. This breadth ensures every user finds a shape for their story.
Detailed Guide: Crafting a Project Timeline Table
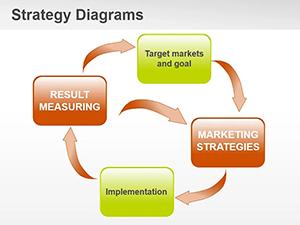
Select Slide 3 as starter. Outline phases in sequential boxes, linking with arrow shapes for sequence. Icon endpoints with milestones, coloring by status - green for on-track. Animate row-by-row reveals to pace discussions, grouping for drag-and-drop rescheduling.
Export slices for email embeds, preserving interactivity. Echoing PM methodologies, it builds timelines that track as tightly as they look.
Superior to Stock: The Shaped Advantage in Tabular Talks
Default tables trap data in grids; these shapes liberate it with form and function, fostering engagement over endurance. Efficient on resources, they render swiftly in virtual setups. Template them for libraries, accelerating future formats.
Box up brilliance - acquire the Table Box PowerPoint Shapes template for $24 and structure triumphs that stand out.
Frequently Asked Questions
Can shapes be ungrouped for full edits?
Yes, right-click to ungroup, accessing individual elements freely.
Suitable for very large datasets?
For extensive data, use linked tables; shapes handle up to 50 rows crisply.
Includes Google Slides version?
PowerPoint primary, but convertible with minor adjustments.
How to add formulas to boxed cells?
Convert back to native tables temporarily, compute, then reshape.
Best for print or screen?
Versatile - high-res vectors suit both, with DPI options on export.
Any tutorials included?
Notes pane features walkthroughs for core techniques.