 Click to zoom
Administrative China PowerPoint Maps Template: Elevate Your Regional Insights
| Format | .pptx |
| Slides | 20 unique layouts |
| Aspect ratio | 16:9 |
| Compatibility | PowerPoint |
| Animated | No |
| Language | English |
| License | Commercial |
| File size | — |
| Version | v1.0 |
| Last updated | May 2024 |
What's inside
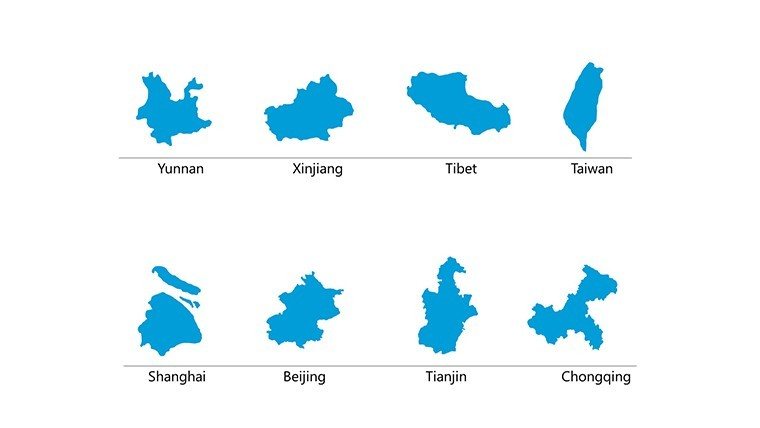
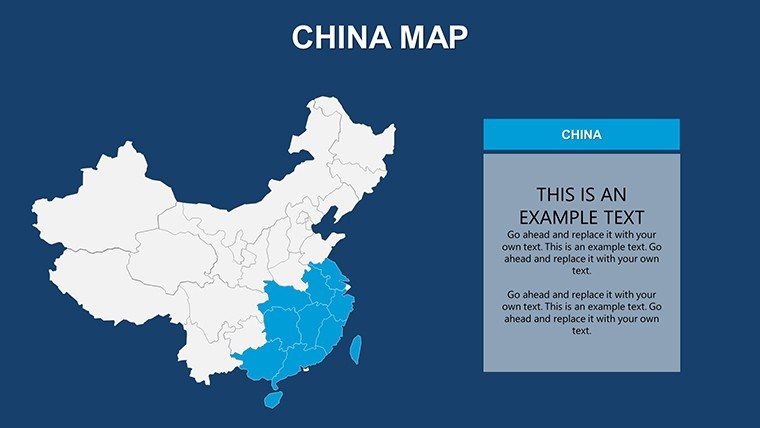
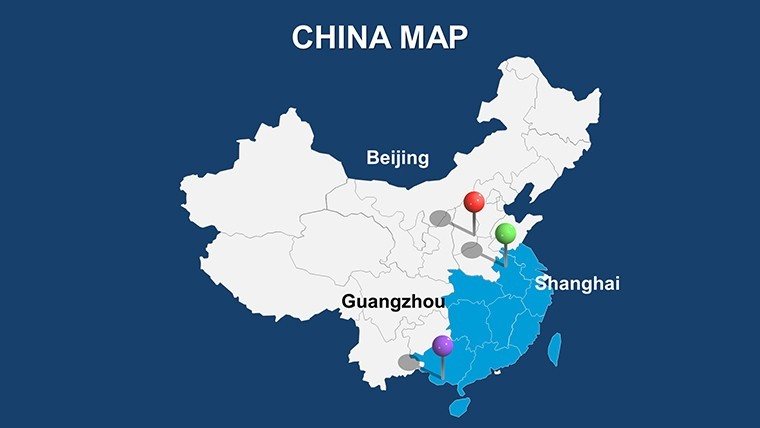
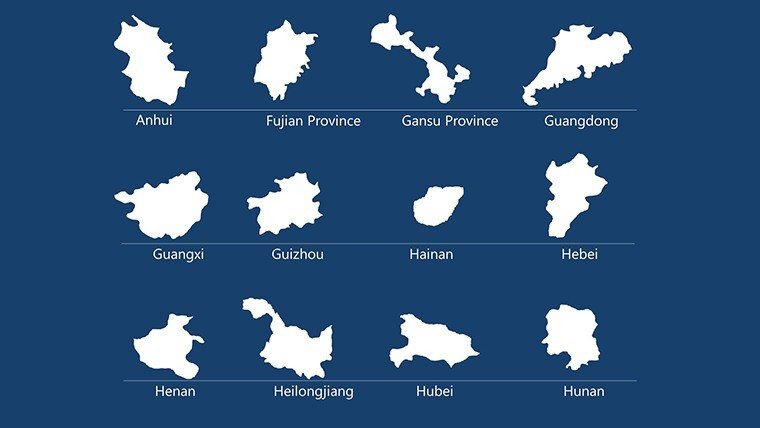
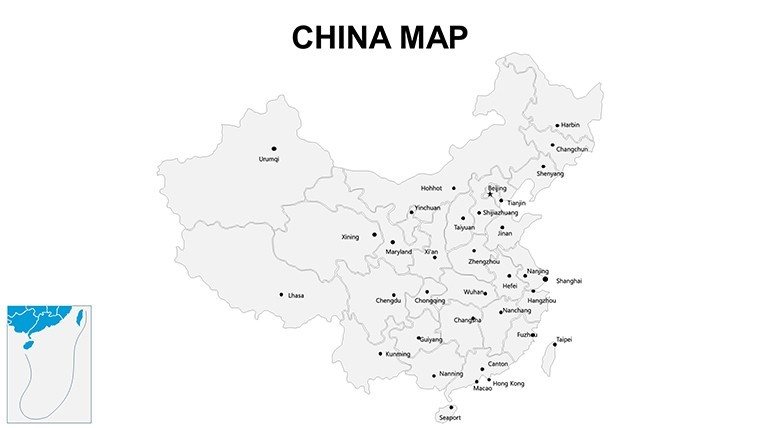
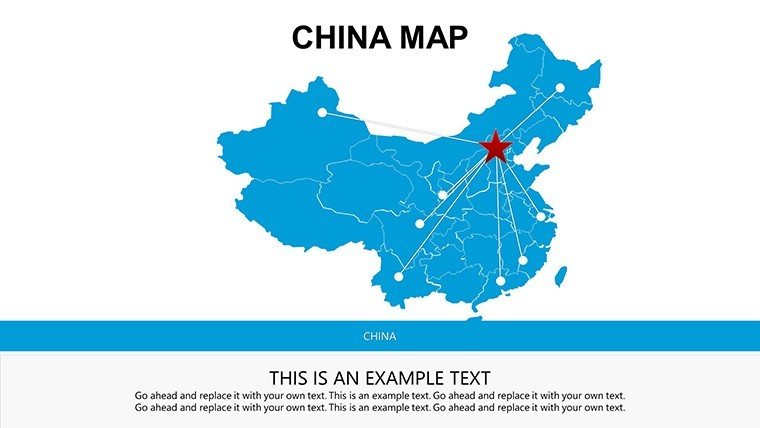
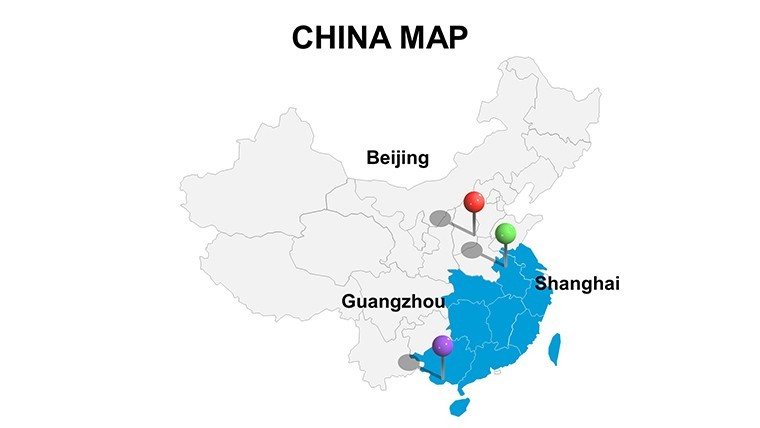
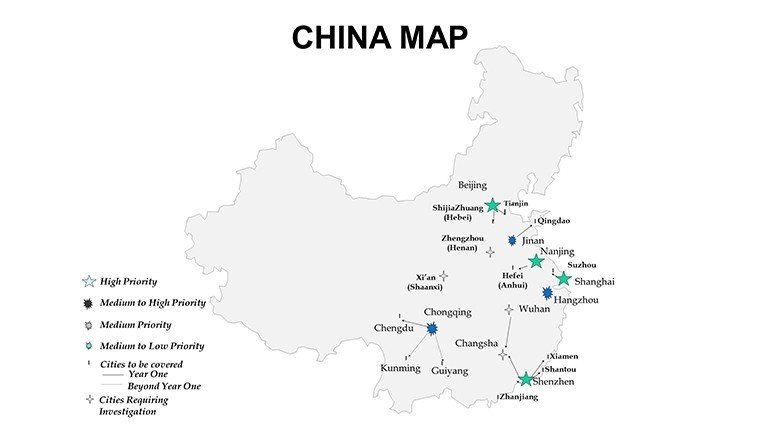
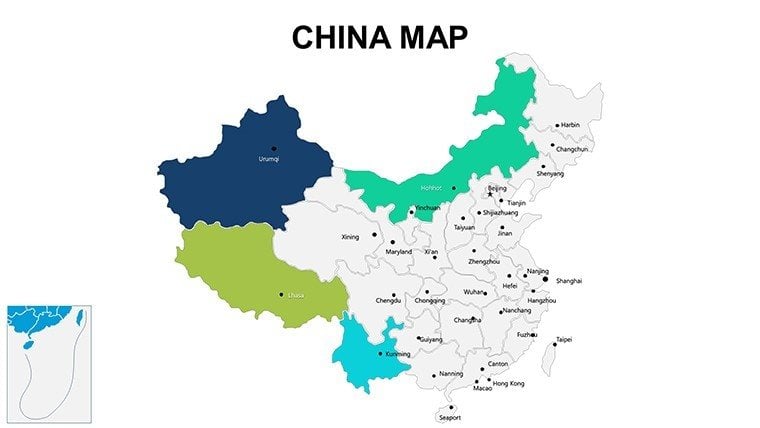
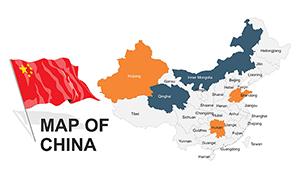
Imagine transforming complex data on China's vast administrative landscape into clear, compelling visuals that captivate your audience. Whether you're a business strategist mapping out market expansion in bustling provinces or an educator illustrating the intricacies of Asian geography, our Administrative China PowerPoint Maps Template is your go-to resource. This meticulously crafted template features 20 fully editable slides, designed to bring precision and professionalism to your presentations. From highlighting major cities like Shanghai and Beijing to delineating provincial borders with pinpoint accuracy, it empowers you to convey regional insights without the hassle of starting from scratch.
In today's global economy, understanding China's administrative divisions isn't just beneficial - it's essential. This template addresses the pain points of professionals who struggle with outdated or generic maps that fail to capture nuanced data. Built for compatibility with PowerPoint 2016 and later versions, including Google Slides, it ensures seamless integration into your workflow. Say goodbye to tedious manual adjustments; our vector-based graphics allow effortless customization of colors, labels, and data overlays. Professionals in international trade, urban planning, and policy analysis have praised its ability to turn raw statistics into storytelling masterpieces, much like how leading firms use it for AIIB project pitches.
Unlocking the Power of Detailed Administrative Mapping
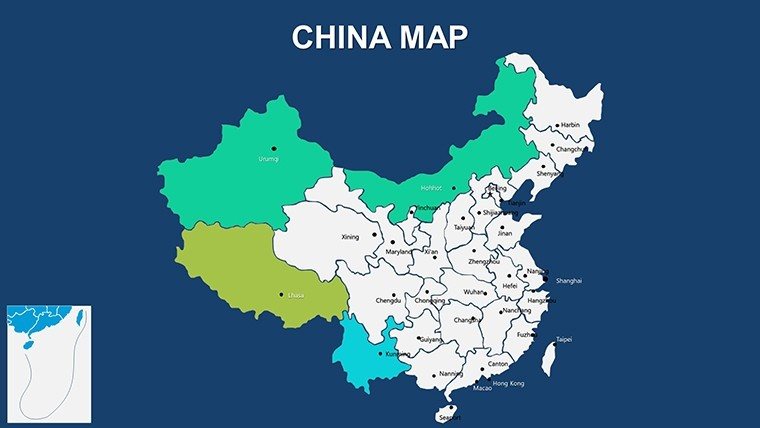
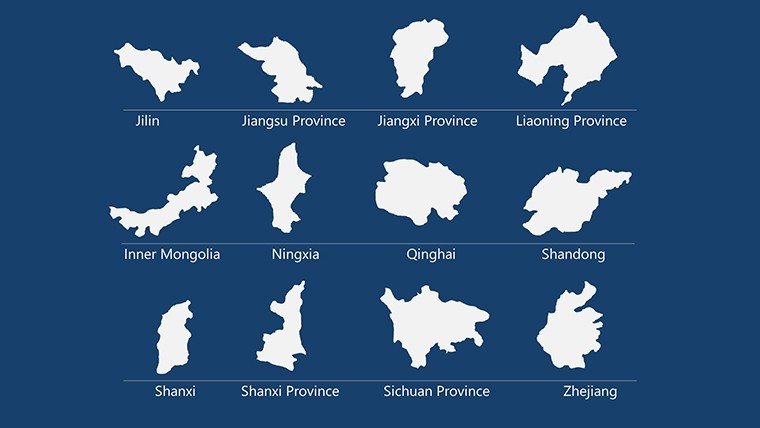
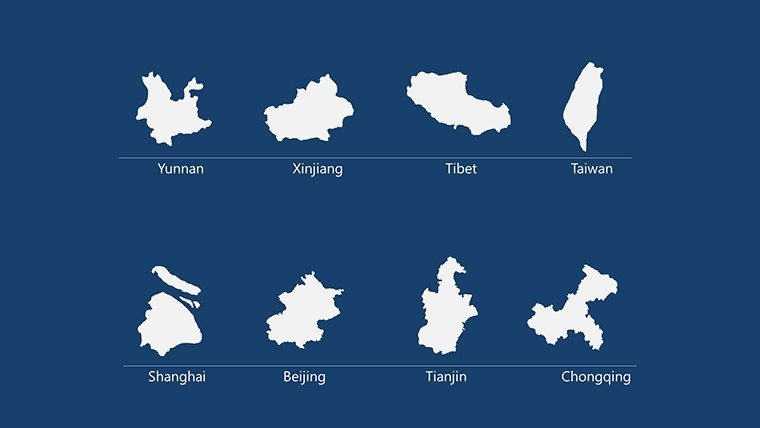
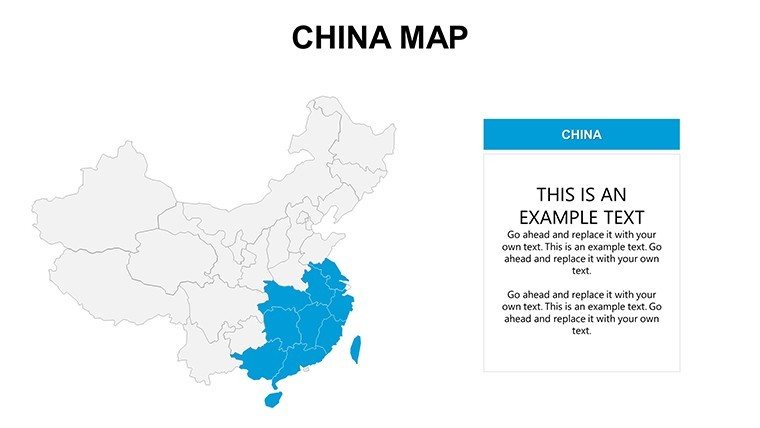
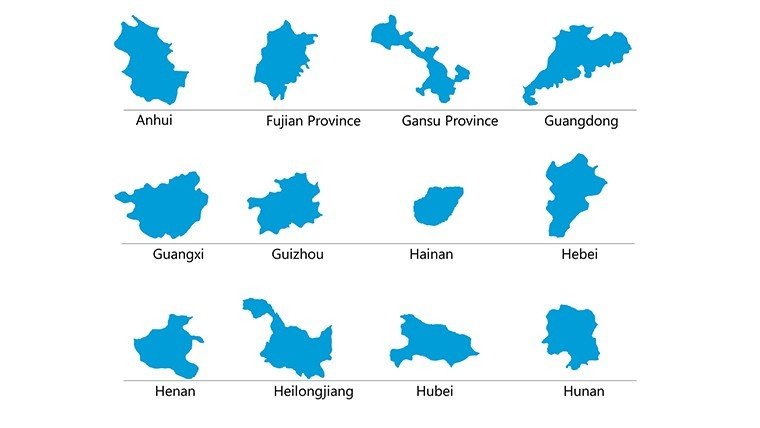
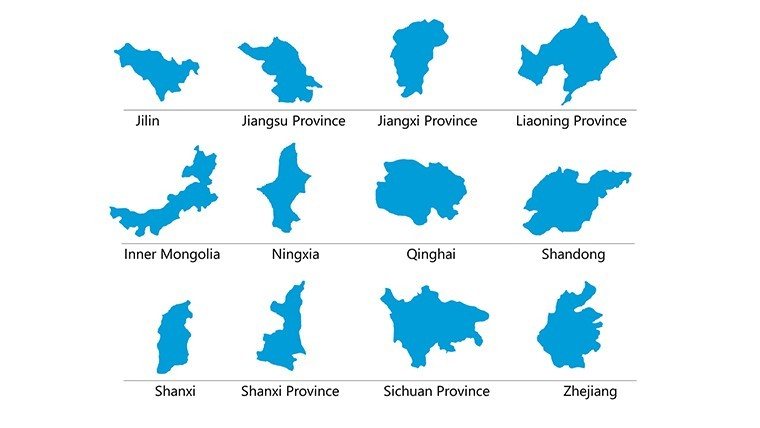
Dive deeper into what makes this template a standout choice for data-driven narratives. Each slide is optimized for high-resolution displays, ensuring your maps remain sharp whether projected in a boardroom or shared virtually. The collection includes overview maps of all 34 provincial-level divisions, including autonomous regions and municipalities, allowing you to zoom in on specifics like Guangdong's economic hubs or Tibet's cultural landmarks.
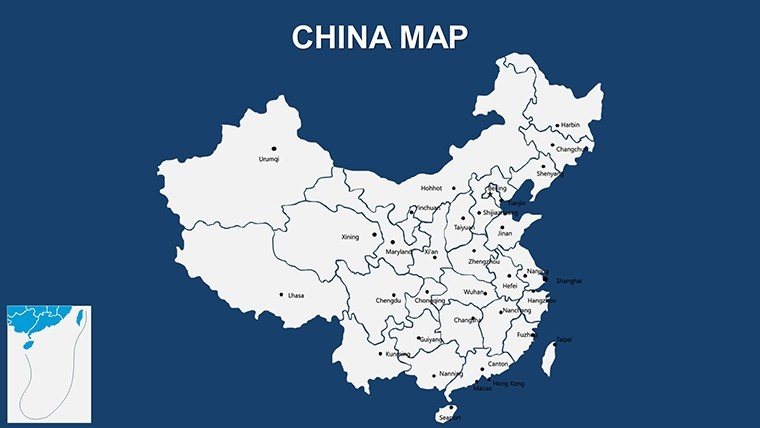
- Comprehensive Coverage: From national overviews to granular city-state breakdowns, every slide is ready to adapt to your needs.
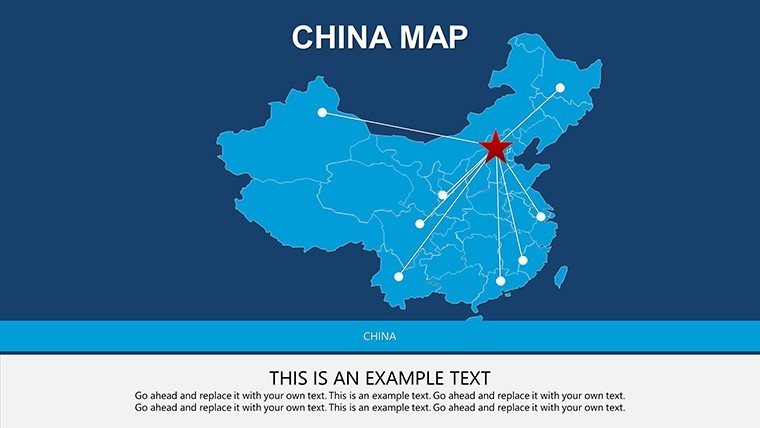
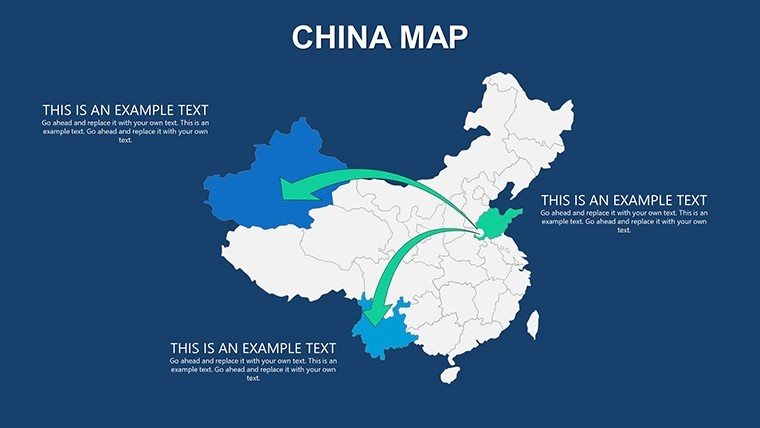
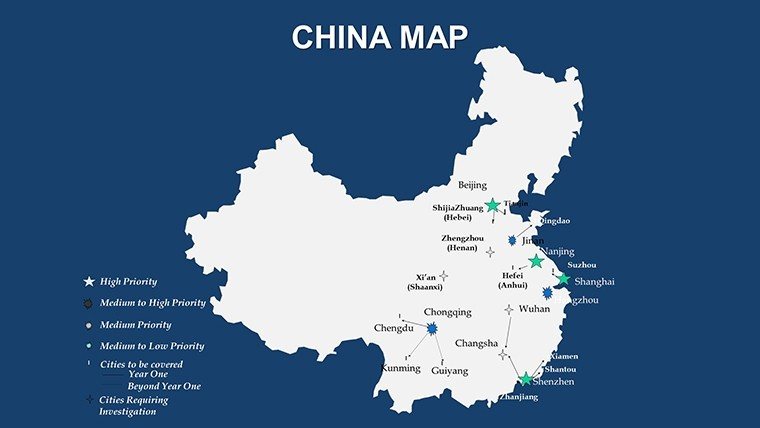
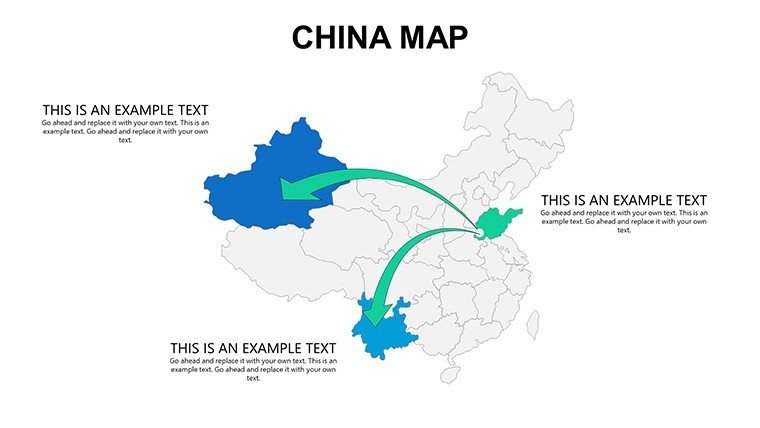
- Editable Elements: Easily modify borders, add icons for key locations, or integrate charts showing GDP distributions across regions.
- Theme Consistency: Pre-applied color schemes inspired by traditional Chinese palettes ensure visual harmony, enhancing brand alignment for corporate users.
For instance, in a real-world scenario, a logistics executive at a multinational firm used this template to illustrate supply chain routes through the Yangtze River Delta. By overlaying shipment data on editable province maps, they secured stakeholder buy-in, demonstrating a 20% efficiency gain in their proposal. This level of customization isn't just convenient - it's a strategic advantage in competitive environments.
Tailored Use Cases for Diverse Professionals
The versatility of our Administrative China PowerPoint Maps Template shines across multiple sectors. Business analysts can leverage it for market penetration strategies, visualizing consumer trends in high-growth areas like the Pearl River Delta. Educators and researchers find it invaluable for lectures on historical migrations or environmental policies, with slides that support interactive annotations during classroom discussions.
In government and NGO settings, it's perfect for policy briefings on regional development initiatives. Consider a case study from a think tank preparing a report on Belt and Road projects: They customized slides to highlight connectivity between provinces, incorporating timelines and infographics that made dense information digestible. The result? A presentation that not only informed but inspired action, aligning with best practices from organizations like the World Bank.
- Business Expansion: Map out investment opportunities by province, integrating sales forecasts with geographic visuals.
- Educational Outreach: Create engaging lessons on China's administrative evolution, using animated transitions for dynamic reveals.
- Research Presentations: Overlay demographic data or climate impacts, drawing from reliable sources like the National Bureau of Statistics.
Beyond these, travel agencies have adapted it for itinerary planning, showcasing cultural routes across regions. The template's drag-and-drop functionality means even non-designers can produce polished outputs in under an hour, saving precious time for content refinement.
Customization Tips to Maximize Impact
Getting started is straightforward, but a few pro tips can elevate your results. Begin by selecting a base slide - say, the full China outline - and use PowerPoint's built-in tools to adjust fill colors for emphasis, like shading high-population areas in vibrant reds. Integrate data via linked Excel sheets for real-time updates, ensuring your maps reflect the latest census figures.
For advanced users, experiment with layering: Add semi-transparent overlays for multiple datasets, such as economic indicators over transportation networks. This technique, recommended by presentation experts at firms like McKinsey, helps in creating multi-dimensional stories that resonate. Always test on different devices to maintain scalability, and incorporate subtle animations to guide viewer attention without overwhelming.
Compared to basic PowerPoint maps, which often lack detail and require extensive redrawing, our template offers pre-vectorized elements that scale infinitely. This means no pixelation issues during zooms, a common frustration in high-stakes pitches. Plus, with included icons for landmarks like the Great Wall, you can enrich narratives culturally, fostering deeper audience connections.
Why This Template Stands Out in a Crowded Market
What sets our Administrative China PowerPoint Maps Template apart? It's not just the 20 slides; it's the thoughtful design rooted in geographic accuracy and user-centric features. Drawing from standards set by cartography bodies like the International Cartographic Association, each map adheres to precise projections for minimal distortion. This trustworthiness builds credibility, especially in academic or regulatory contexts.
Users appreciate the commercial license, allowing unlimited use in professional settings without extra fees. Free updates ensure compatibility with future PowerPoint versions, future-proofing your investment. In testimonials, a university professor noted how it simplified teaching Sino-European trade dynamics, while a startup founder credited it for landing a key investor by visually mapping their China entry strategy.
Integrate it with other tools like Tableau for advanced visualizations, or pair it with our Asia-themed templates for broader regional coverage. The result is a cohesive presentation suite that positions you as an expert.
Ready to Map Your Success?
Don't let subpar visuals hinder your message. Download the Administrative China PowerPoint Maps Template today and start crafting presentations that inform, persuade, and inspire. With its blend of precision and flexibility, it's the tool every global professional needs. Customize now and watch your ideas take geographic shape.
Frequently Asked Questions
Is this template compatible with Google Slides?
Yes, it's fully compatible with Google Slides, allowing seamless editing and sharing for collaborative teams.
How editable are the map elements?
All elements, including borders, labels, and colors, are vector-based and fully editable without losing quality.
Can I use this for commercial purposes?
Absolutely, it comes with a commercial license for unlimited business use.
Does it include data sources?
The template provides blank maps; integrate your data from official sources like China's National Bureau of Statistics.
What file formats are available?
It's delivered as a .pptx file, compatible with PowerPoint 2016 and newer.
Good for
- Project roadmaps and sprint plans
- Product launch timelines
- Quarterly or annual review decks
- Company history and milestone summaries
Licence
reviews
The location graphics looked clean in PowerPoint.
I used the world map slide for a market report.
Everything was easy to customize.
A few map colors were too strong for my taste.
Pretty useful for office presentations.
FAQ
Will it work in Google Slides?
Are fonts embedded?
Can I use this for client work?
What's the refund policy?
Do you update the template after purchase?
Available in bundles
Get this template cheaper as part of a bundle pack.
 This item

 This item
Similar templates
See all PowerPoint Maps →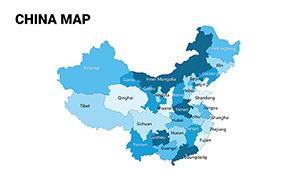

All 20 slides