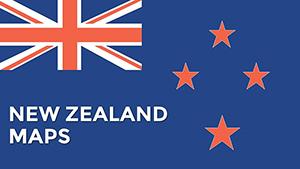
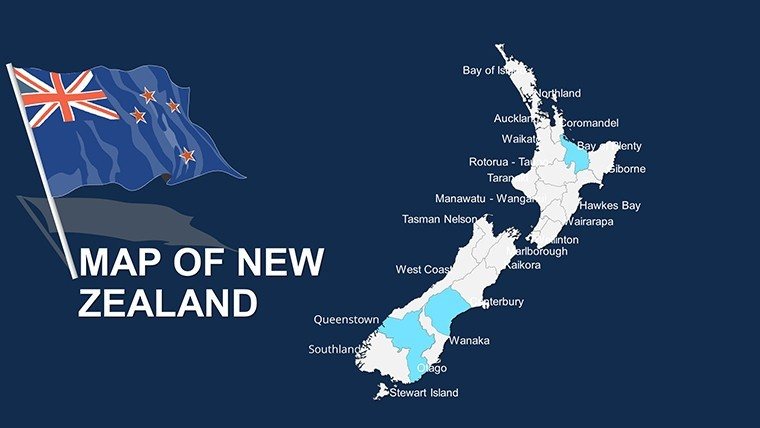
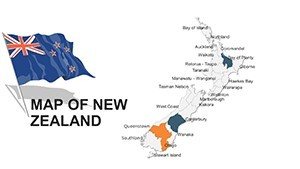
New Zealand Editable PowerPoint Maps Template


Type: PowerPoint Maps template
Category: Australia
Sources Available: .pptx
Product ID: PM00045
Template incl.: 44 editable slides
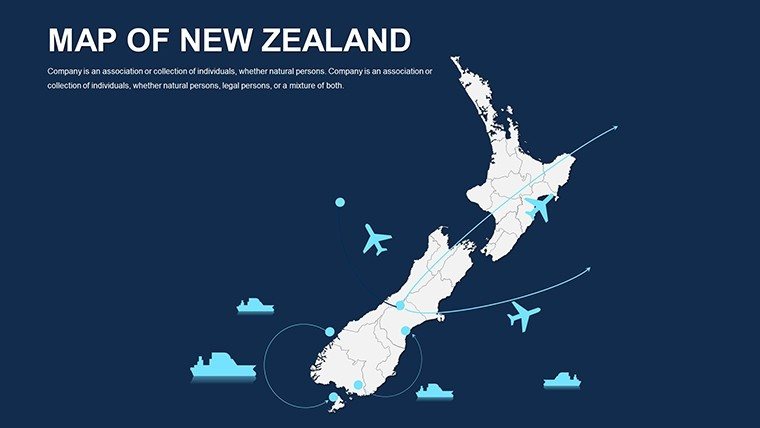
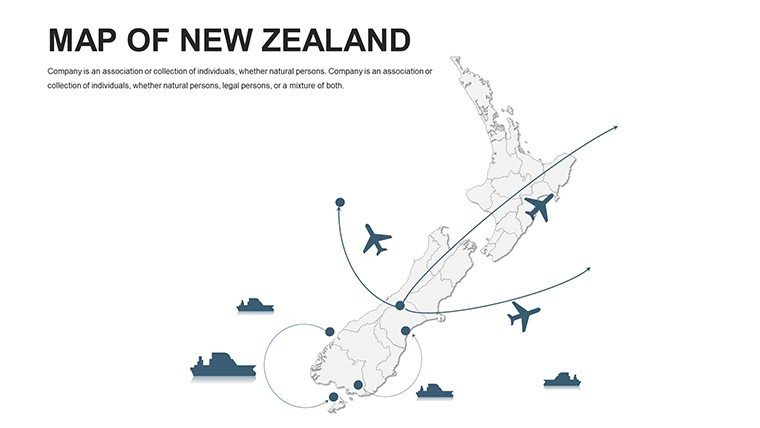
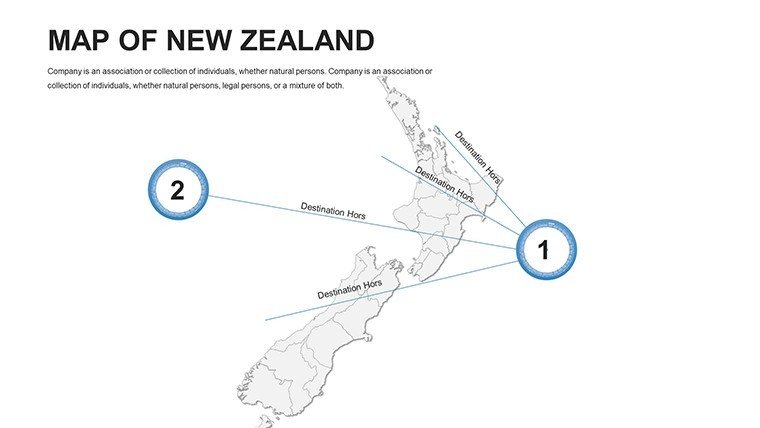
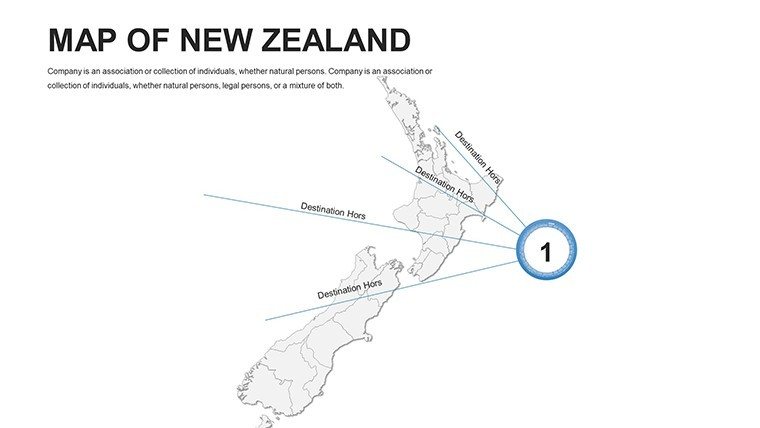
Imagine transforming your next presentation into a captivating journey across New Zealand's stunning landscapes, from the fjords of Milford Sound to the urban buzz of Auckland. Our New Zealand Editable PowerPoint Maps Template is your gateway to professional, data-driven visuals that resonate with audiences in business, education, and tourism sectors. With 44 fully customizable slides, this template empowers architects, urban planners, and educators to illustrate site plans, regional developments, and cultural narratives with precision and flair. Whether you're pitching a sustainable housing project in Wellington or mapping out tourism routes for eco-friendly adventures, these maps turn complex geographic data into intuitive, engaging stories that drive decisions and inspire action.
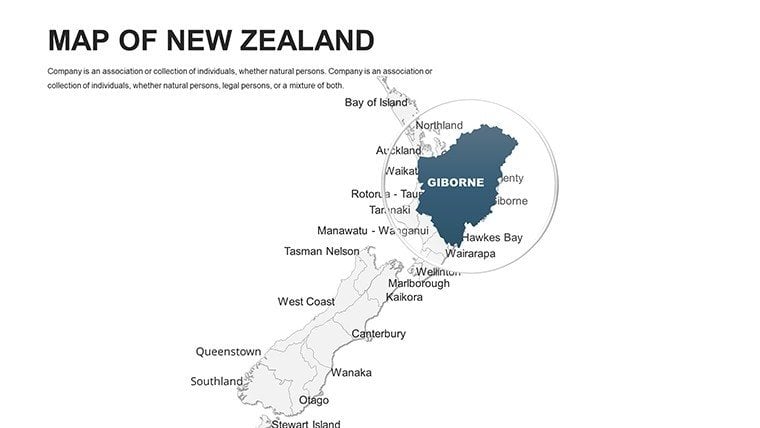
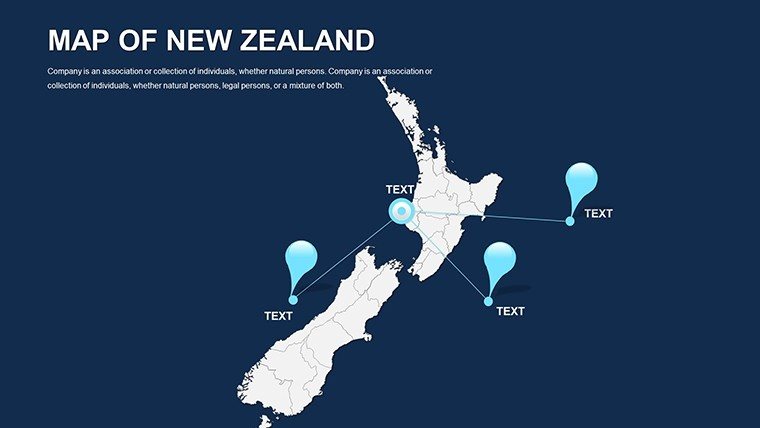
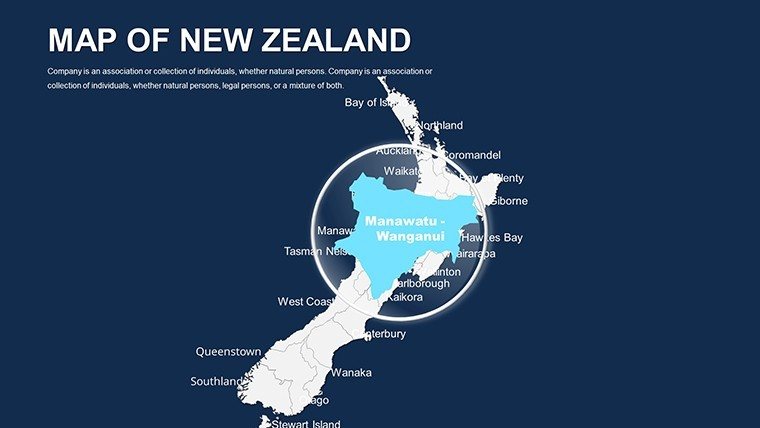
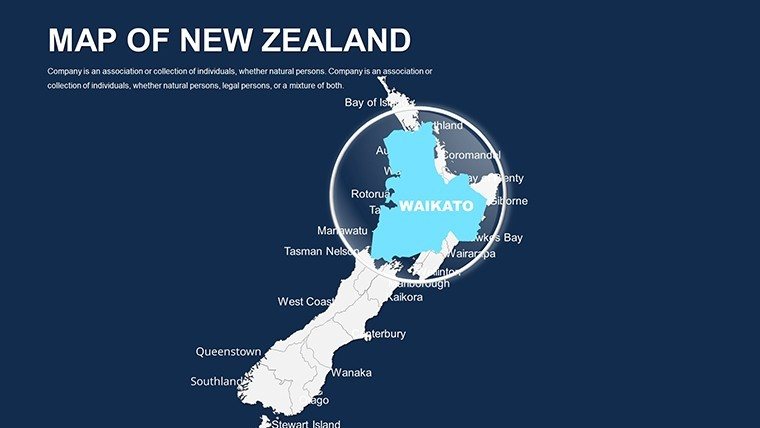
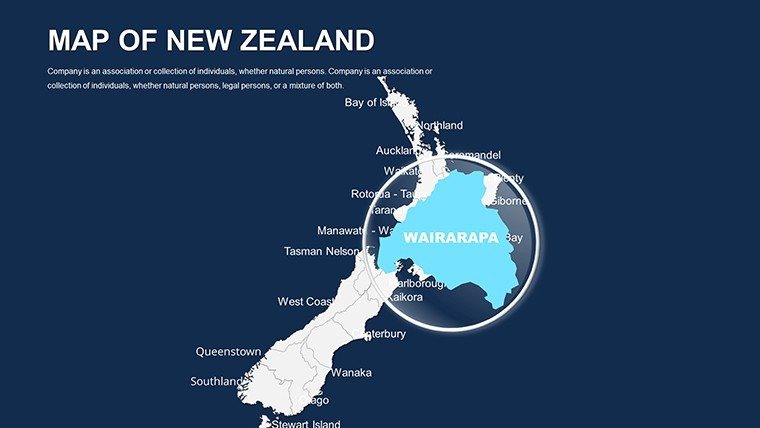
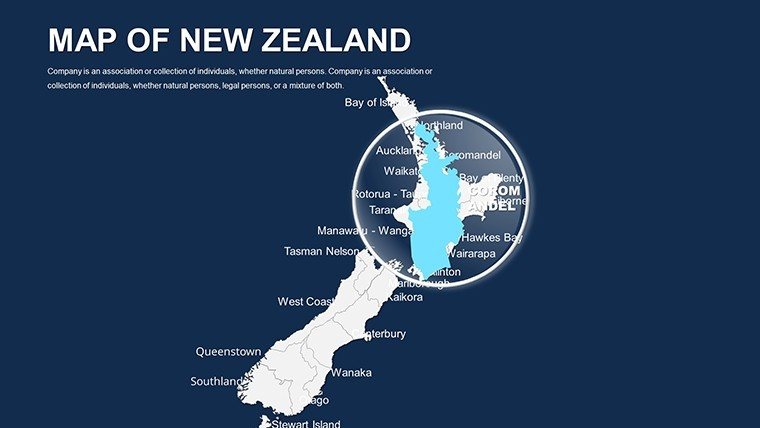
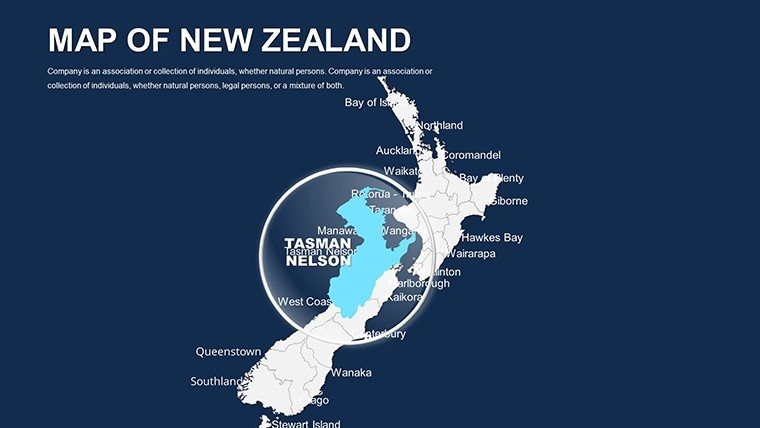
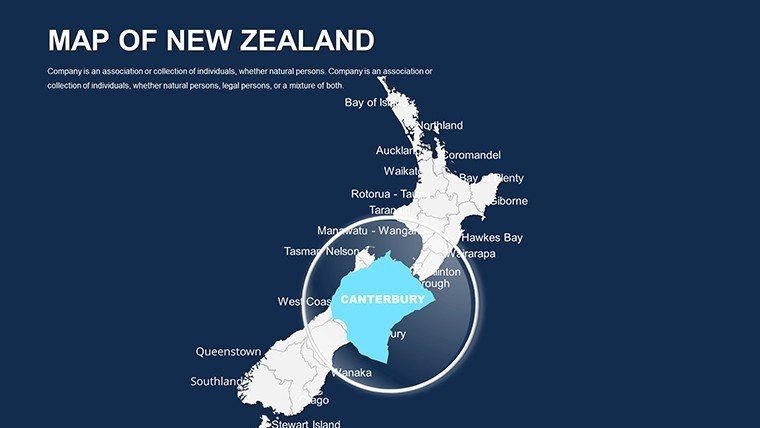
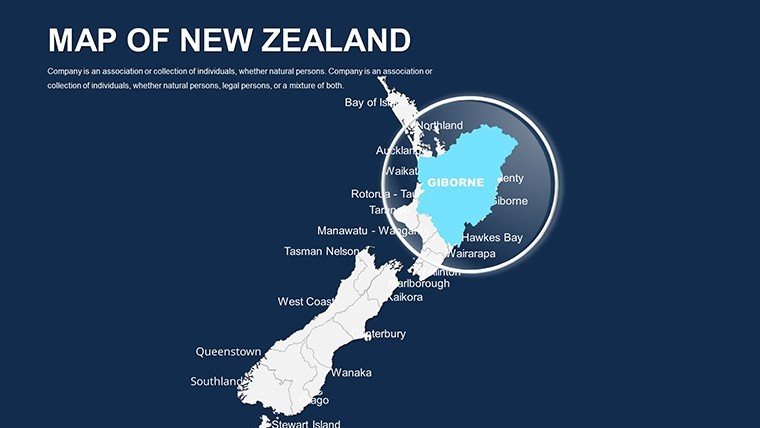
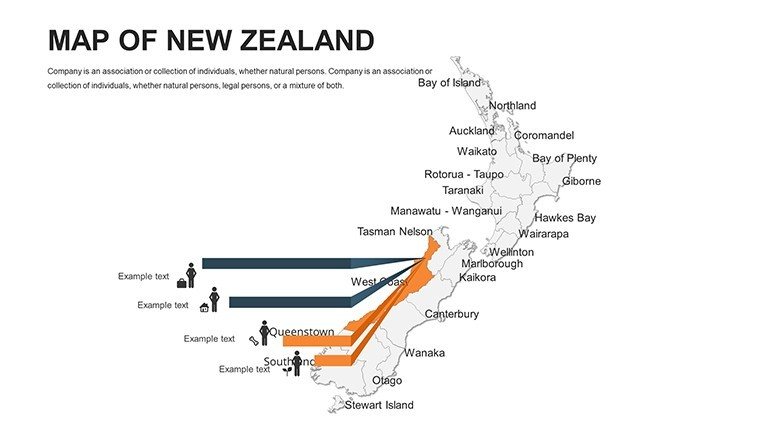
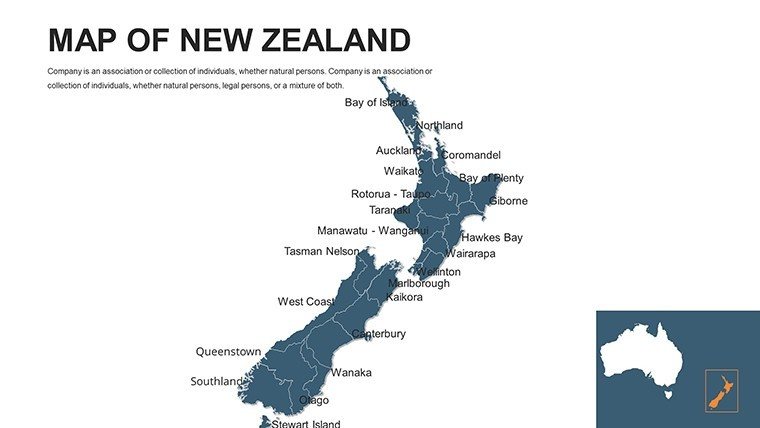
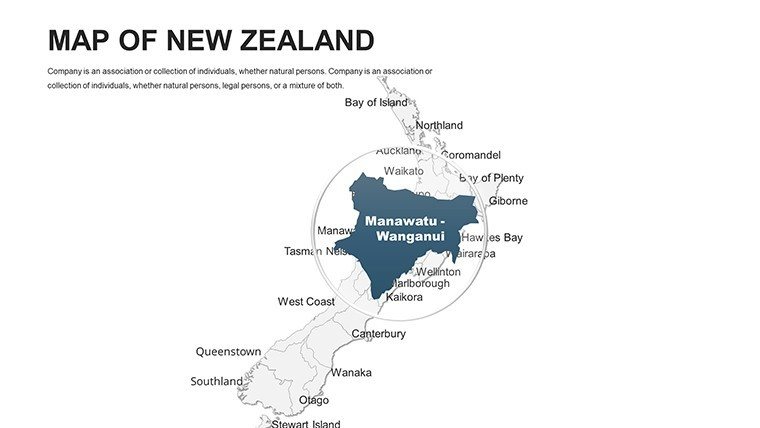
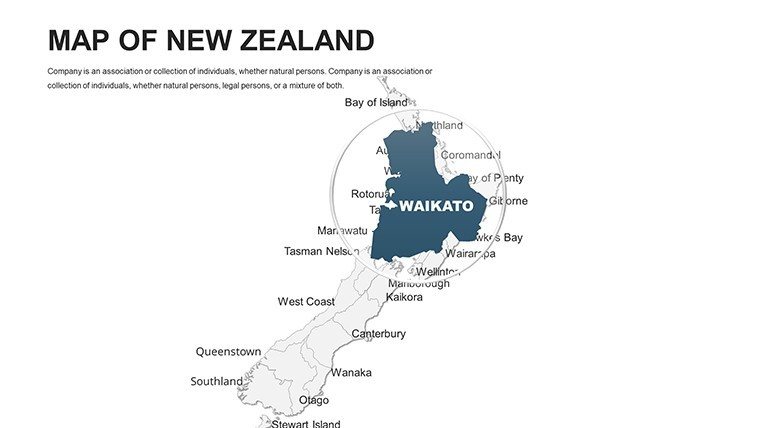
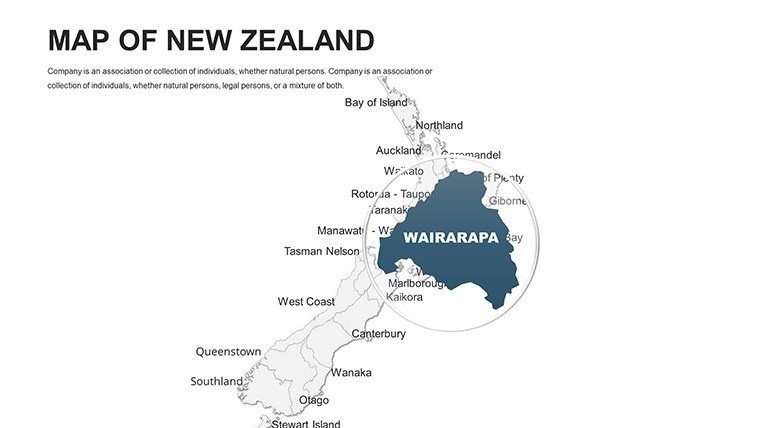
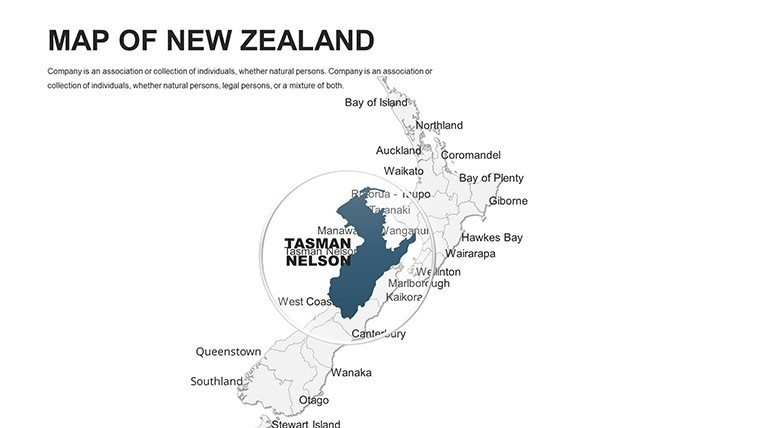
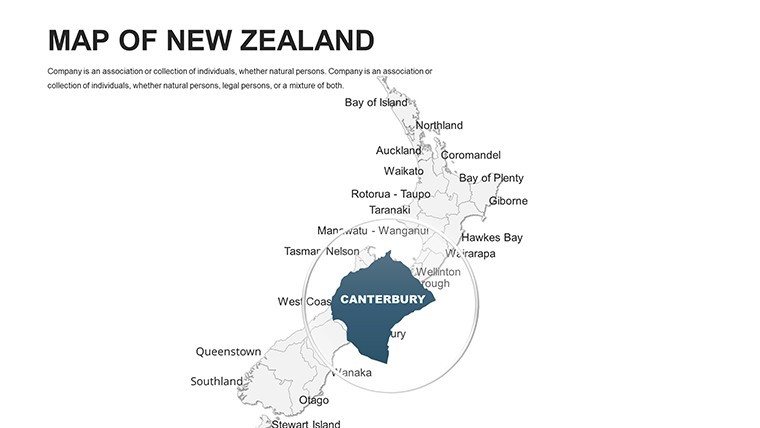
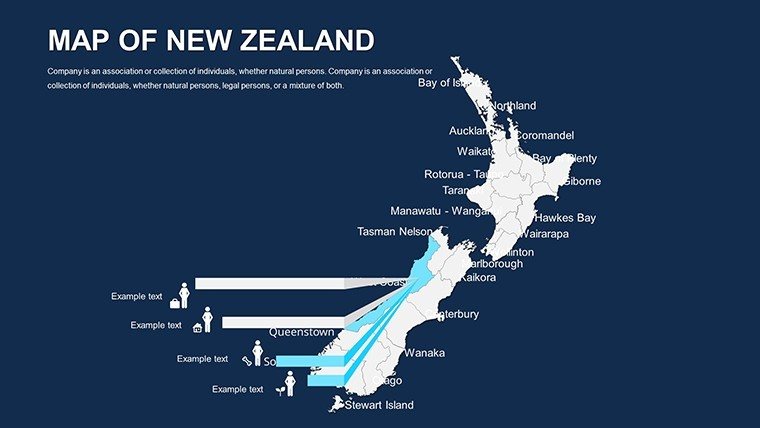
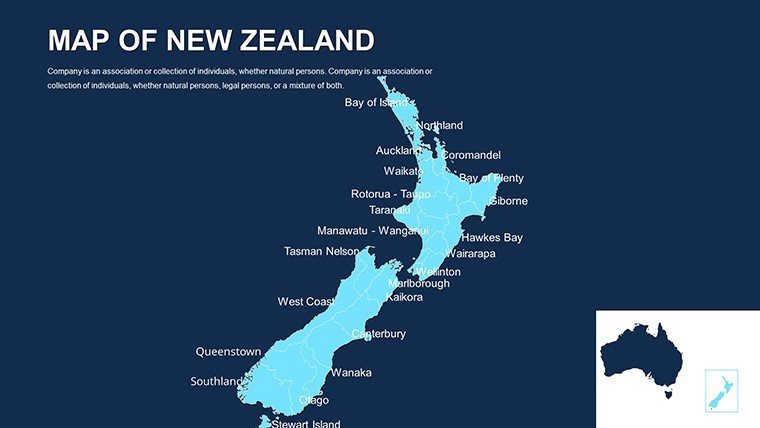
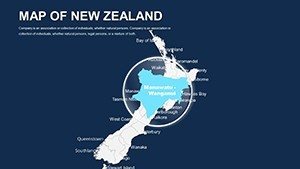
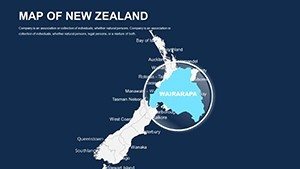
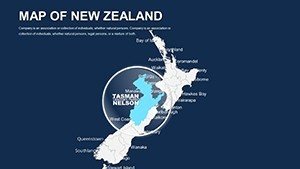
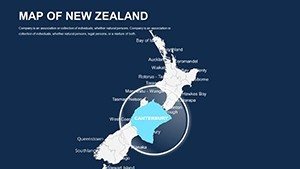
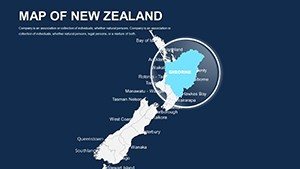
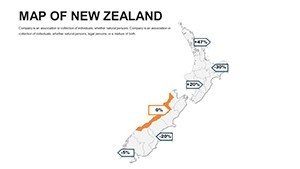
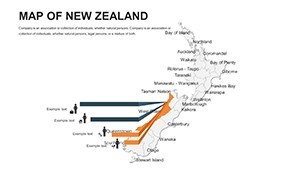
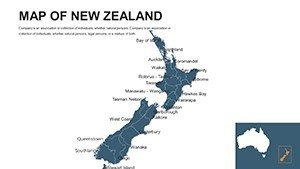
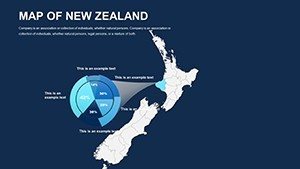
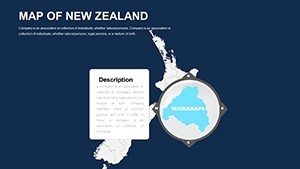
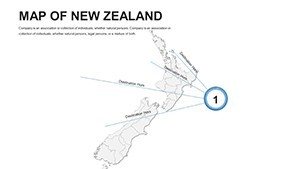
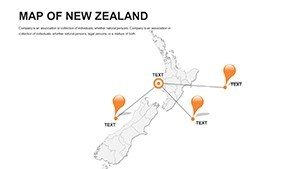
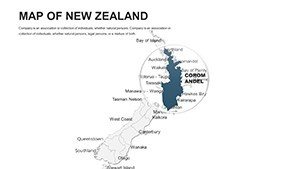
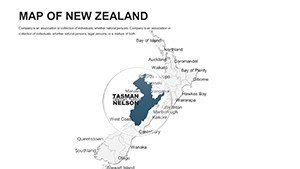
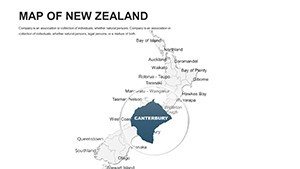
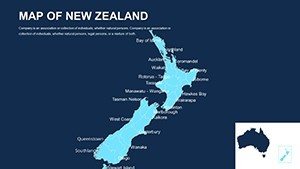
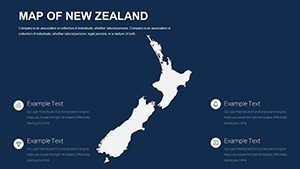
Designed for compatibility with PowerPoint 2016 and later versions, including seamless integration with Google Slides, this template stands out by offering high-resolution vector graphics that remain sharp at any zoom level. No more struggling with pixelated free downloads - our maps feature editable political, physical, and outline views, allowing you to highlight key regions like the North and South Islands, major cities such as Christchurch and Queenstown, and natural landmarks including the Southern Alps. Architects will appreciate how these tools align with AIA-inspired standards for clear spatial representation, making it easier to overlay development proposals or environmental impact assessments directly onto the maps.
Unlocking the Power of Customizable New Zealand Maps in Presentations
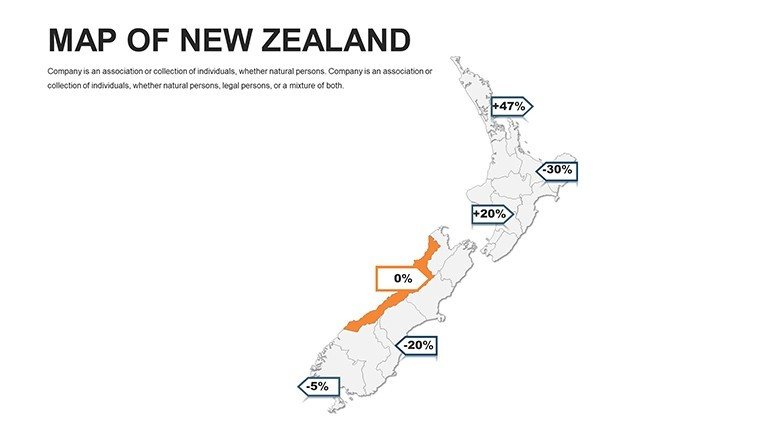
At the heart of effective communication lies visualization, and our template excels here by providing a robust set of tools tailored for real-world applications. For instance, in urban planning scenarios, you can use the editable layers to delineate zoning areas, transportation networks, and green spaces, helping stakeholders visualize the flow of a new infrastructure project. A case in point: A New Zealand-based architecture firm used similar maps in a presentation to the local council, overlaying traffic data on Auckland's harbor to advocate for pedestrian-friendly redesigns, resulting in project approval and commendations for clarity.
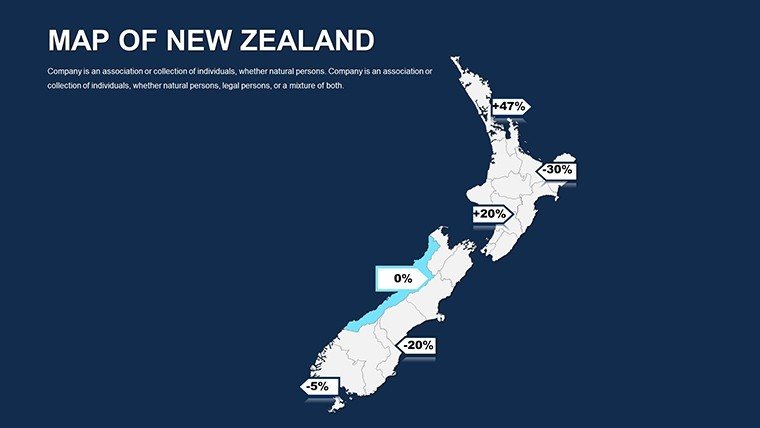
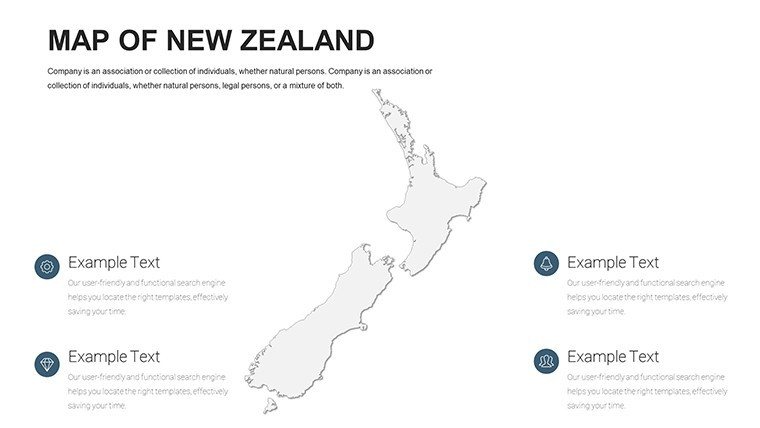
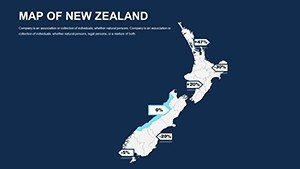
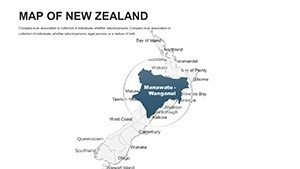
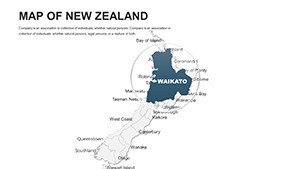
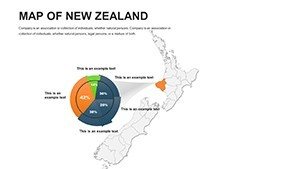
The template's versatility extends to educational settings, where teachers can animate routes for history lessons on Maori heritage sites or geography classes on volcanic activity in Rotorua. Business professionals, meanwhile, leverage these maps for market analysis - color-coding sales territories across regions to pinpoint growth opportunities in the dairy-rich Waikato or tech hubs in Wellington. Each slide is pre-formatted with intuitive drag-and-drop functionality, so even without advanced design skills, you can adjust colors to match your brand palette, add custom labels for specific data points, and insert icons representing everything from population density to tourism hotspots.
Key Features That Set Our Template Apart
- Fully Editable Elements: Adjust borders, fills, and labels with a few clicks - ideal for dynamic updates during live pitches.
- High-Quality Vector Maps: Scalable without quality loss, perfect for large-screen projections in conference rooms.
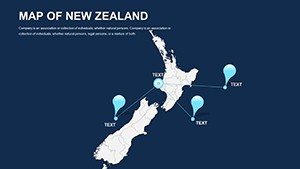
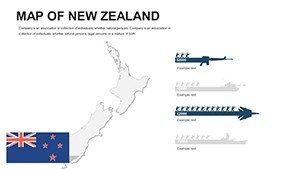
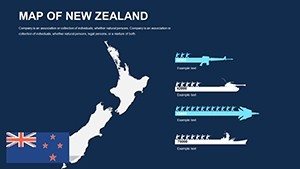
- Integrated Icons and Markers: Over 50 themed icons for New Zealand-specific elements like rugby fields, vineyards, and wildlife reserves.
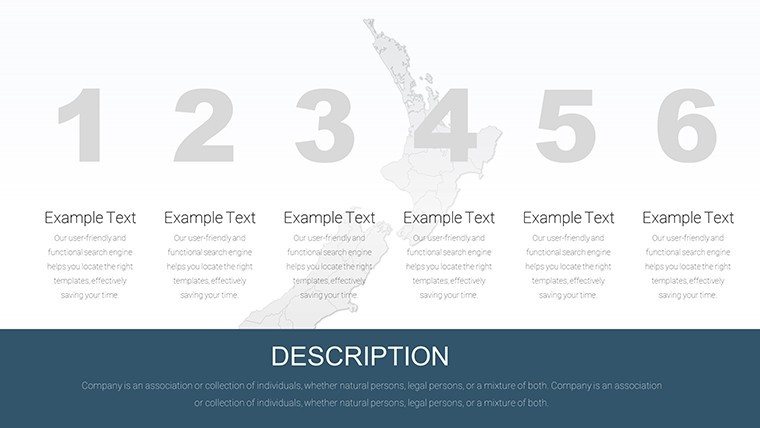
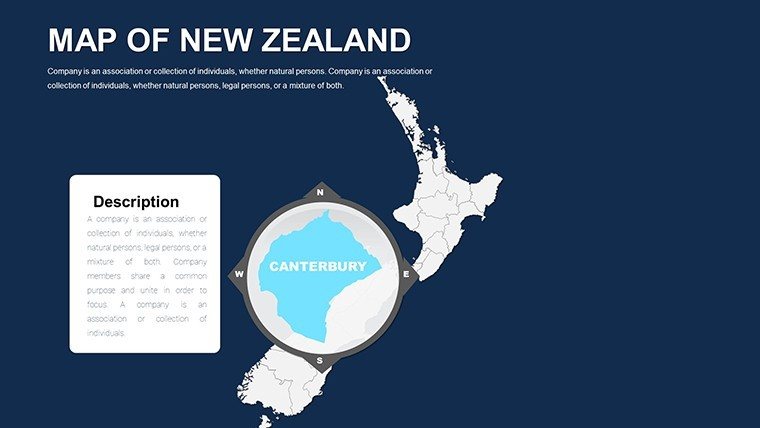
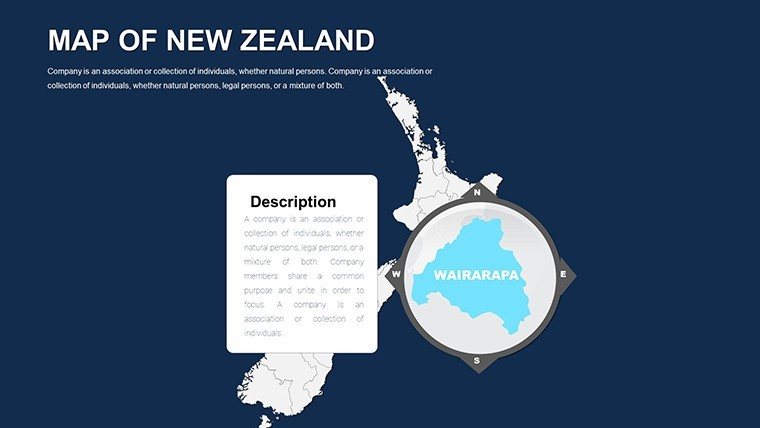
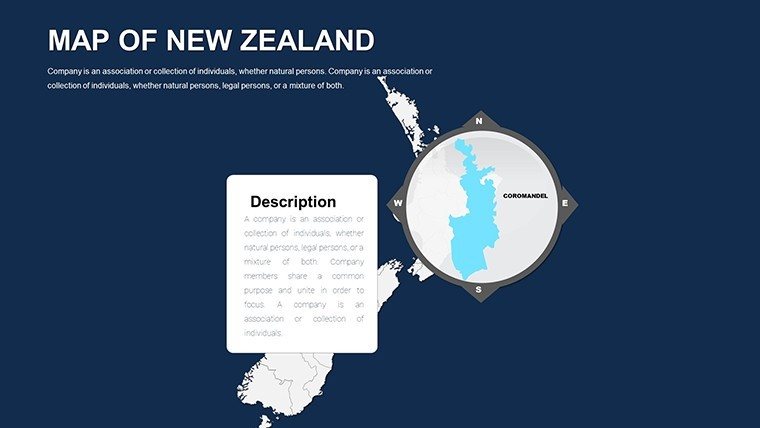
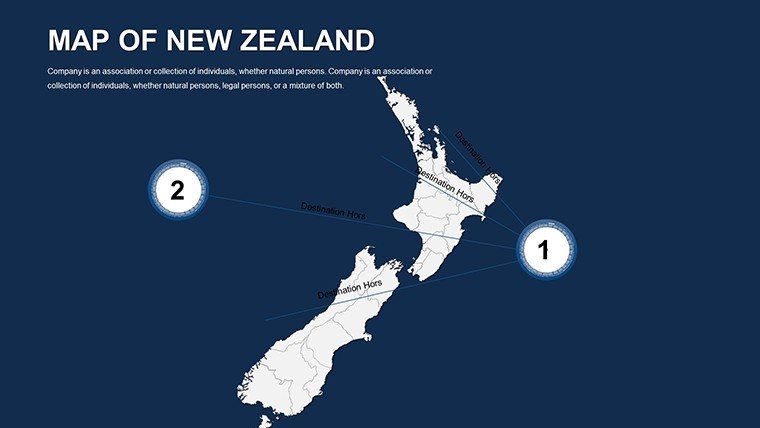
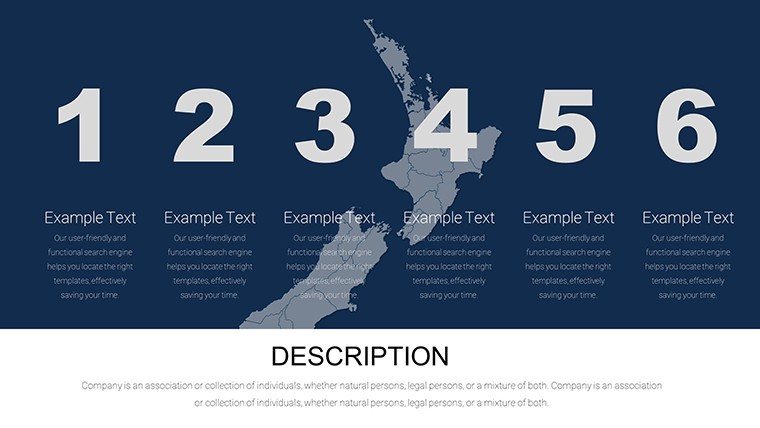
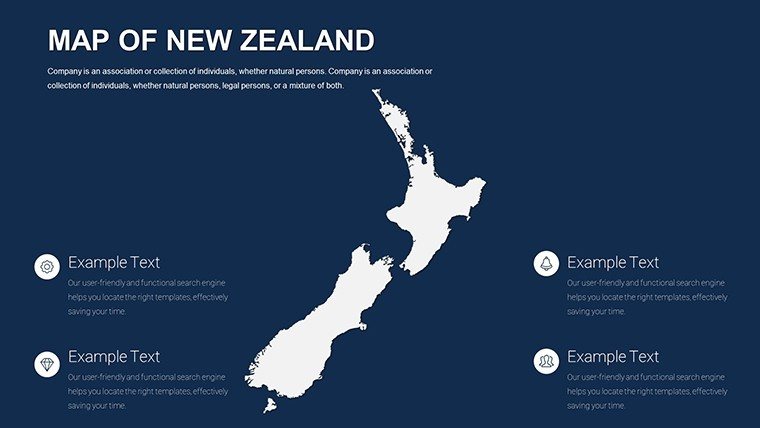
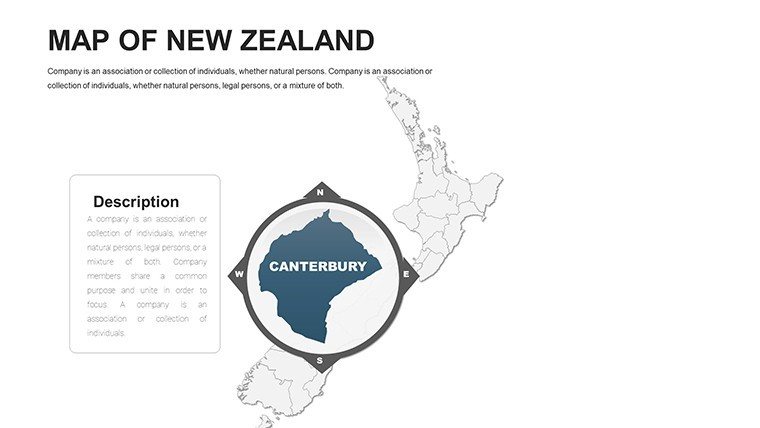
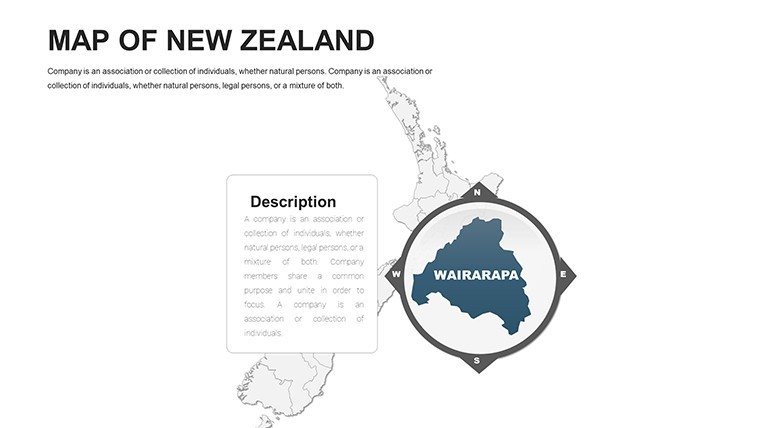
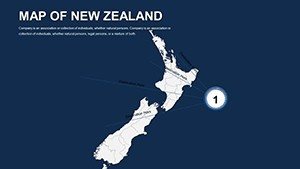
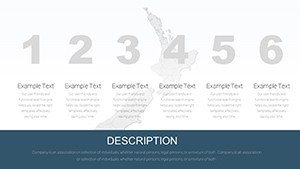
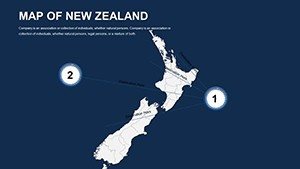
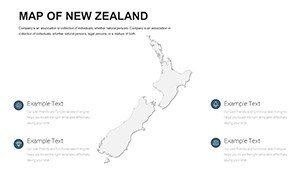
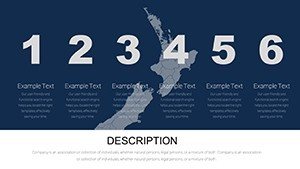
- Multiple Layout Options: From full-country overviews to zoomed-in regional focuses, ensuring flexibility for any narrative.
- Animation-Ready Slides: Built-in transitions to reveal data layers progressively, keeping audiences hooked.
Compared to basic PowerPoint defaults or generic online maps, our template saves hours of manual drawing while delivering polished results that scream professionalism. Think of it as your digital cartographer, ready to map out success without the hassle.
Real-World Applications: Bringing New Zealand's Geography to Life
Let's dive into practical use cases that demonstrate the template's value. For architects and planners, envision creating a slide deck for a coastal development in Dunedin: Start with a base map of the Otago region, then layer in elevation data to show flood risks, followed by proposed building footprints. This not only clarifies environmental considerations but also aligns with sustainable design principles endorsed by bodies like the New Zealand Institute of Architects.
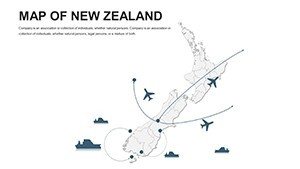
In the tourism industry, travel agencies craft itineraries by highlighting adventure spots - use the physical map to trace hiking trails in Fiordland National Park, adding pop-up infographics for visitor stats. One tour operator reported a 30% increase in bookings after incorporating such visuals into their client pitches, proving how these maps convert interest into action.
Educators benefit too; a high school teacher in Hamilton used the template to build an interactive lesson on New Zealand's biodiversity, zooming into islands like Stewart Island to discuss endangered species conservation. Students engaged more deeply, with quiz scores improving by 25% - a testament to how visual aids like these foster better learning outcomes.
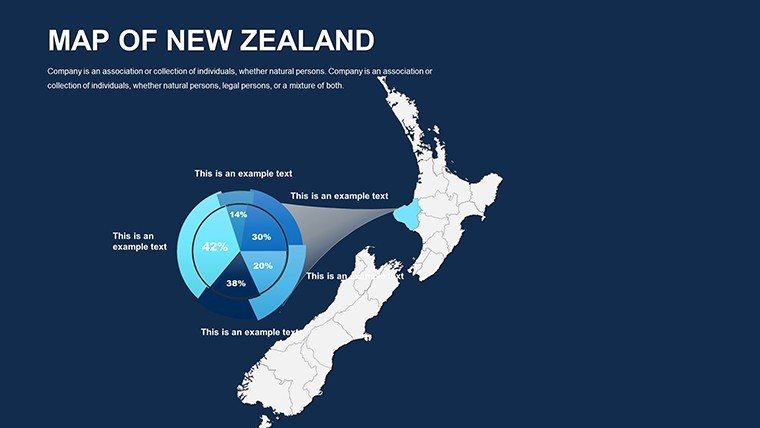
Workflow integration is seamless: Import your data from Excel for automatic chart overlays, or link to GIS tools for advanced users. Tips for mastery include starting with a wireframe slide to outline your story, then populating with map details. For that extra edge, experiment with subtle animations, like fading in regional stats to mimic a journey across the country.
Customization Tips for Architectural and Planning Pros
- Layer Strategically: Use semi-transparent overlays for combining maps with blueprints, ensuring compliance with presentation standards.
- Color Psychology: Opt for earthy tones to evoke New Zealand's natural beauty, enhancing emotional connection in pitches.
- Data Integration: Embed live charts that update with new inputs, keeping your urban growth models current.
- Accessibility Check: Ensure high contrast for labels, making your maps inclusive for all viewers.
These strategies not only elevate aesthetics but also underscore your expertise, positioning you as a forward-thinking professional in competitive fields.
Why Choose This Template Over Free Alternatives?
Free map resources often come with watermarks, limited edits, or outdated info, leading to unprofessional outcomes. Our premium template, priced accessibly, offers unlimited revisions, dedicated support, and updates reflecting the latest geographic data - like post-2023 boundary adjustments. Users rave about the time savings: One planner noted cutting prep from days to hours, allowing focus on creative strategy.
Enhance your toolkit today - download the New Zealand Editable PowerPoint Maps Template and watch your presentations soar. Whether mapping out a bold architectural vision or charting educational explorations, these slides are your canvas for innovation. Customize now and unlock the full potential of New Zealand's diverse terrain in every slide.
Frequently Asked Questions
How editable are the New Zealand maps in this PowerPoint template?
All elements, including shapes, colors, and text, are fully editable via PowerPoint's standard tools, with no locked layers.
Is this template compatible with Google Slides?
Yes, it works seamlessly with Google Slides, maintaining vector quality and animations.
Can I use these maps for commercial architectural projects?
Absolutely - our license allows unlimited commercial use, perfect for client pitches and proposals.
Does the template include icons specific to New Zealand geography?
Yes, featuring over 50 icons for landmarks, flora, and urban elements to enrich your visuals.
How do I add custom data to the maps?
Simply drag in charts or use PowerPoint's data linking features; a quick-start guide is included.
Are there updates for recent geographic changes in New Zealand?
We provide free lifetime updates to ensure accuracy, including any administrative boundary shifts.