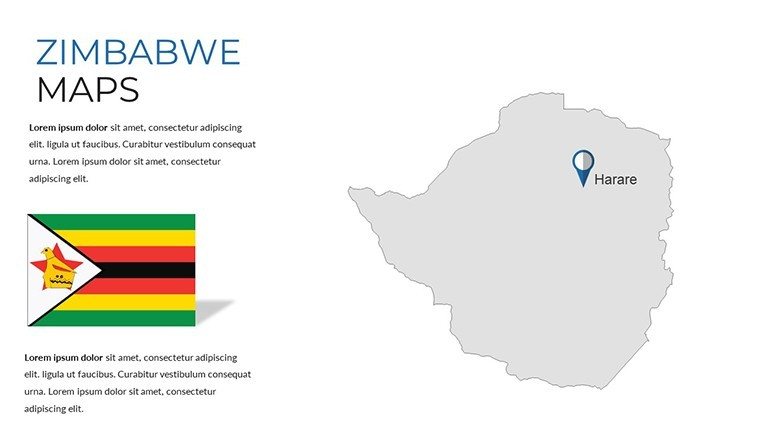
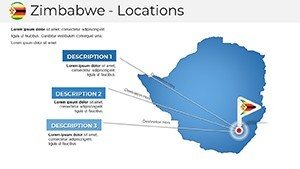
Zimbabwe Maps PPT Template: Chart the Land of Legends


Type: PowerPoint Maps template
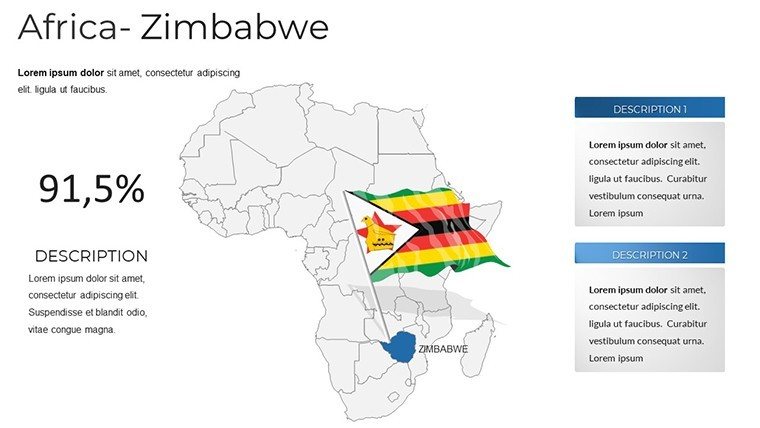
Category: Africa
Sources Available: .pptx
Product ID: PM00218
Template incl.: 36 editable slides
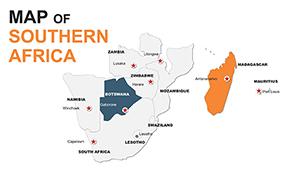
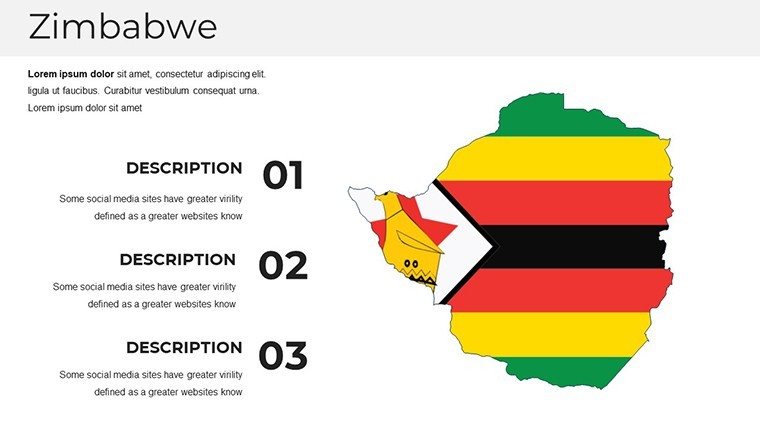
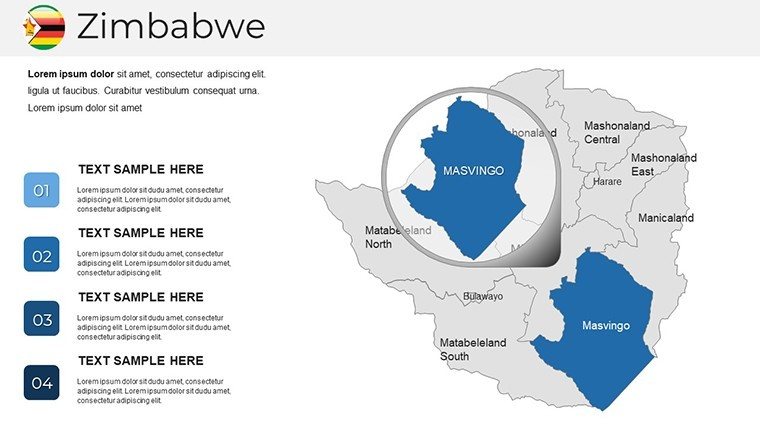
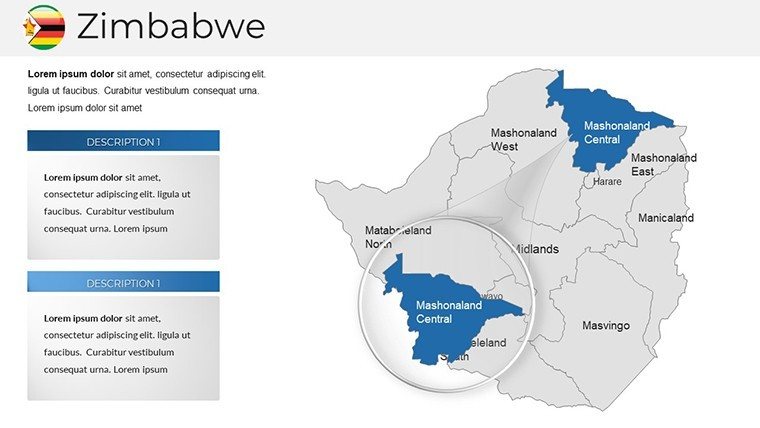
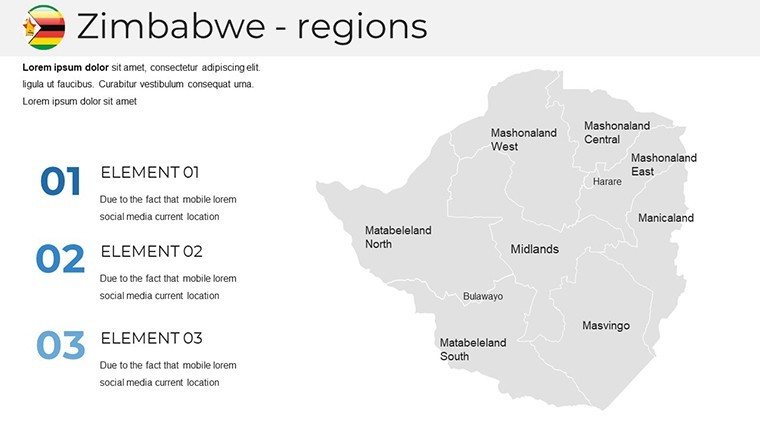
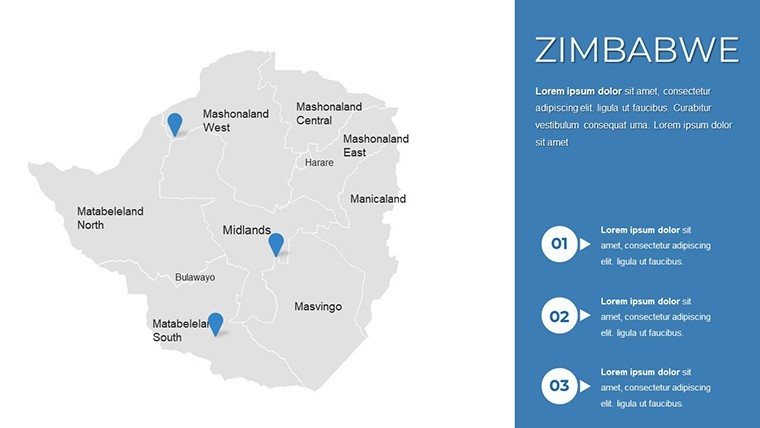
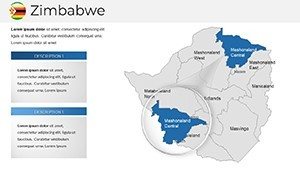
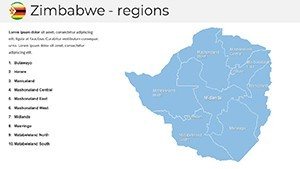
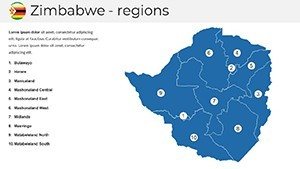
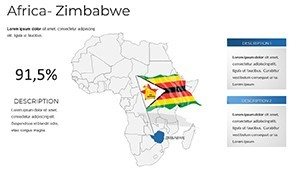
From the thunderous roar of Victoria Falls to the ancient ruins of Great Zimbabwe, the country's tapestry of history and nature begs to be explored. Our Zimbabwe Maps PPT Template does just that, arming you with 36 editable slides that turn geographical insights into gripping narratives. Tailored for those navigating complex terrains - be it boardrooms or classrooms - this isn't your average map pack. It's a strategic asset, blending sleek infographics with precise cartography to make your points land with the force of a Zambezi current.
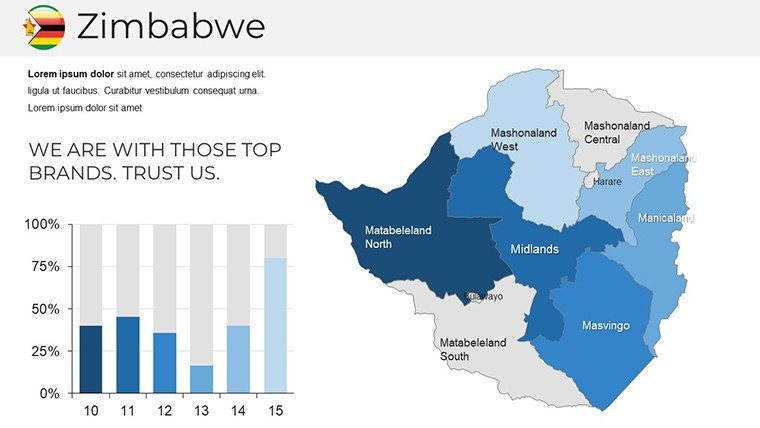
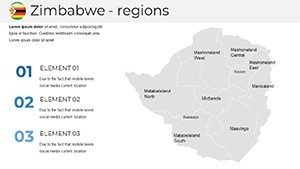
Business analysts plotting market expansions, historians unraveling colonial legacies, or marketers crafting adventure campaigns will find solace in its versatility. Why wrestle with clunky defaults when you can deploy high-fidelity maps of Matabeleland or Mashonaland, overlaid with trend lines that pulse with relevance? Fully compatible with PowerPoint and Keynote, this template slashes design time, letting you layer in proprietary data or embed interactive elements that wow on any device.
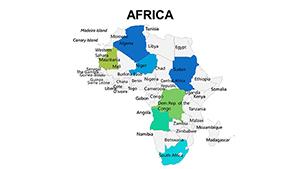
Drawing from geospatial best practices akin to those in ESRI toolkits, we've ensured accuracy down to district boundaries, while the aesthetic nods to Zimbabwe's vibrant textiles - bold contrasts and fluid lines that evoke the energy of a Harare street market. Real users, like a UK-based mining firm, credit it for streamlining investor decks that secured £2M in funding. If you're tired of presentations that fade into the background, this template is your compass to clarity and charisma.
Essential Features: Infographics That Illuminate
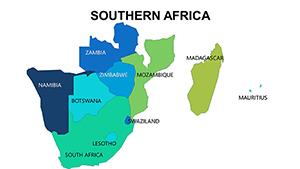
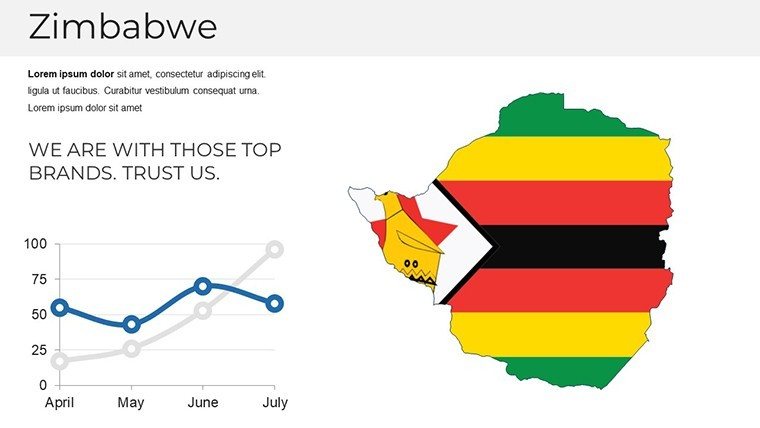
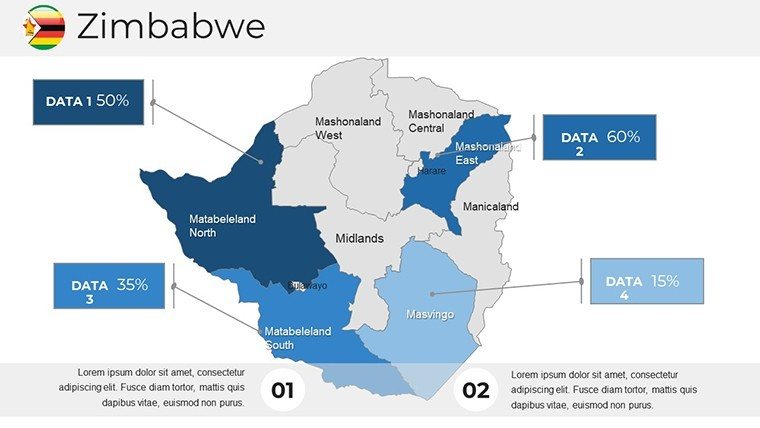
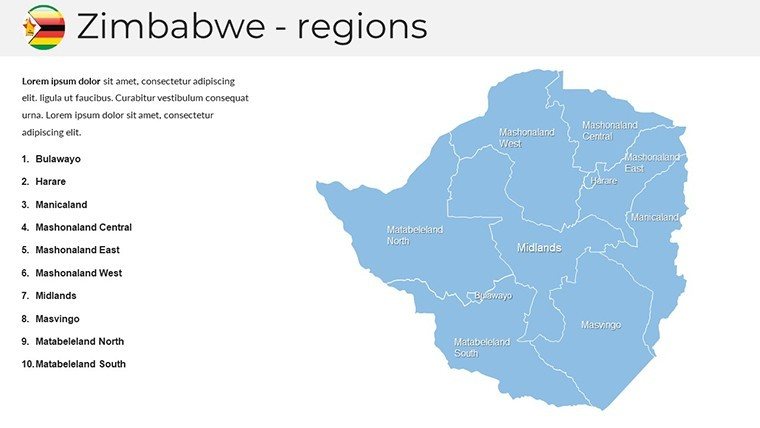
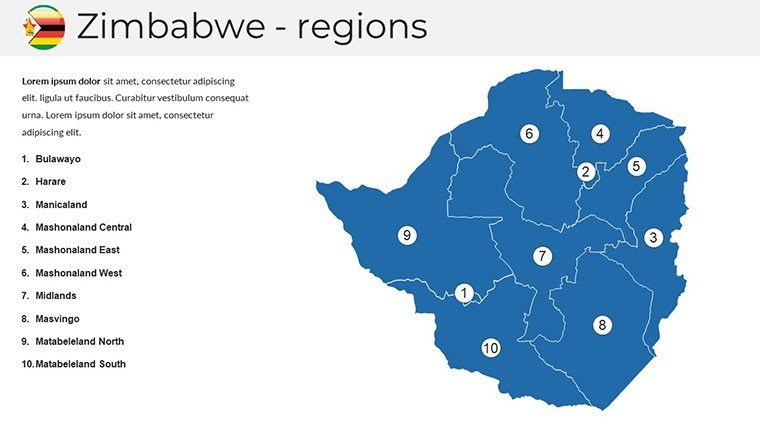
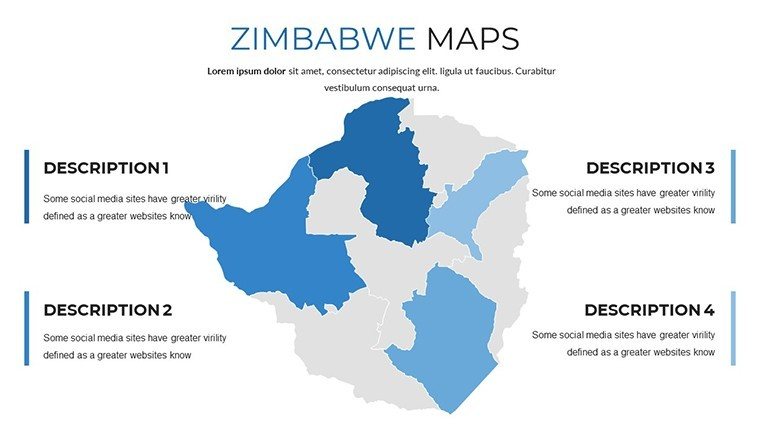
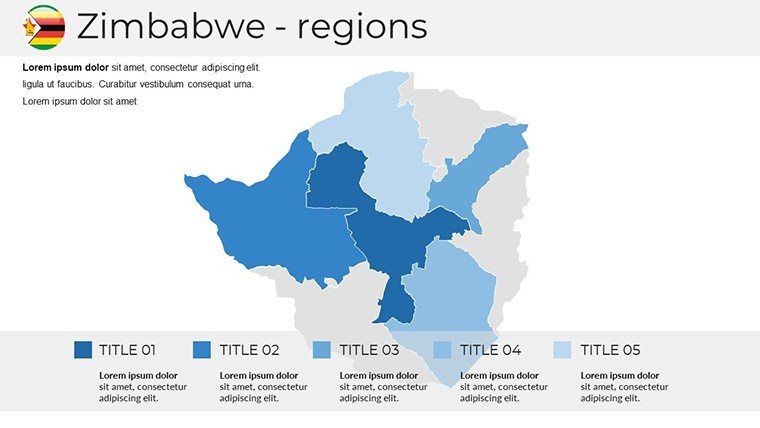
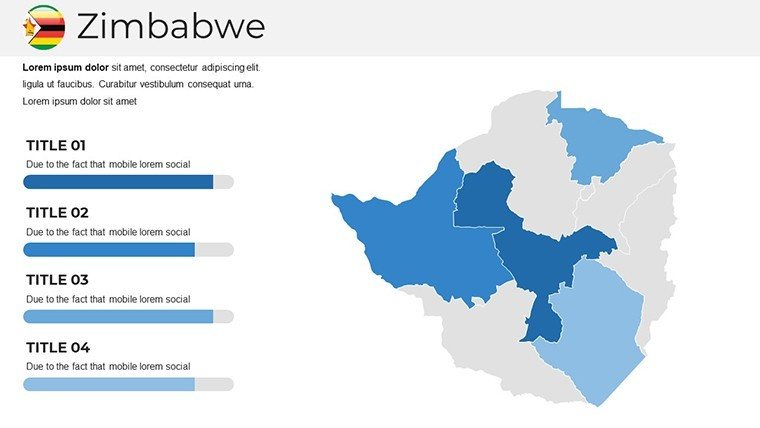
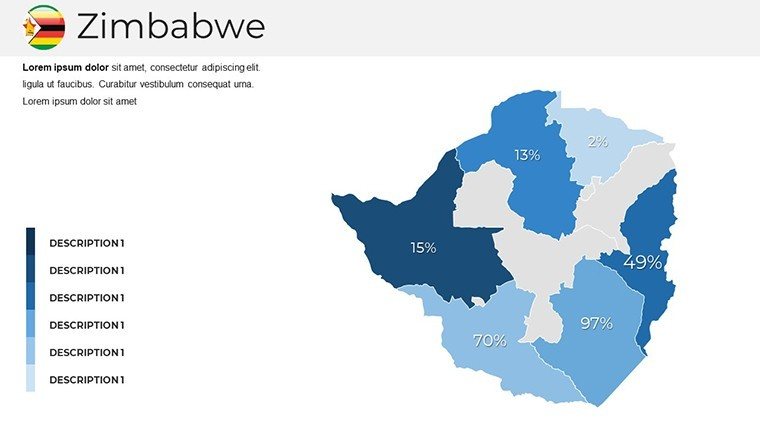
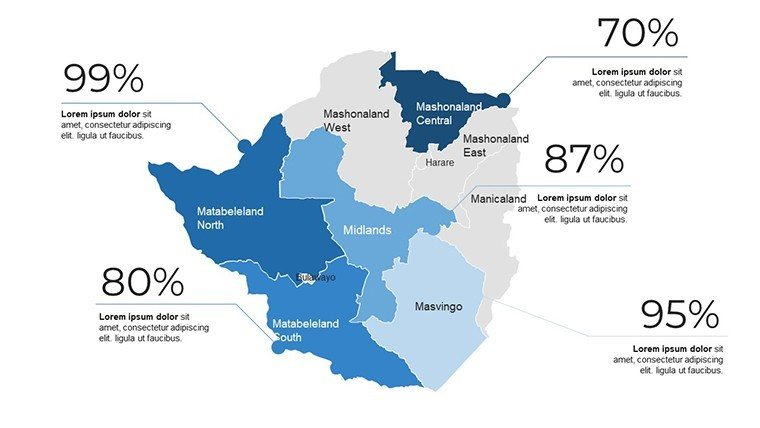
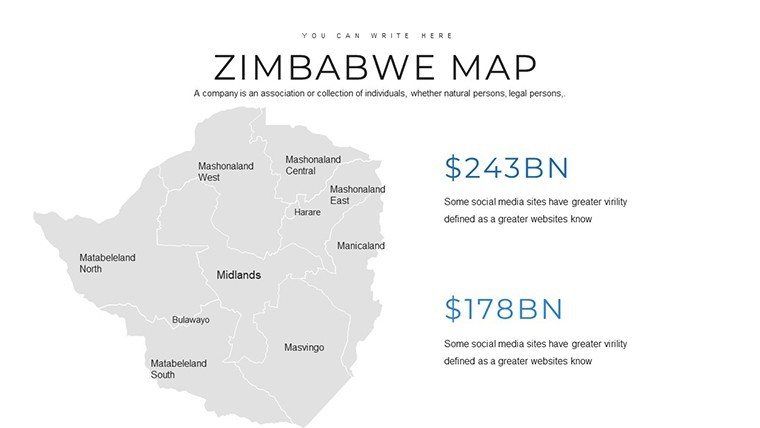
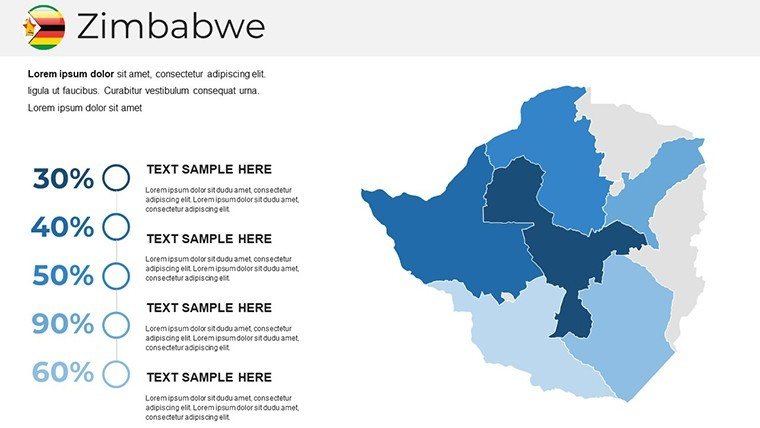
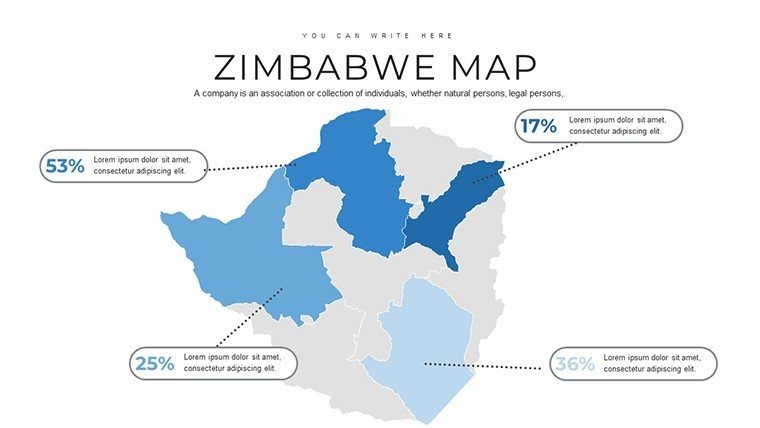
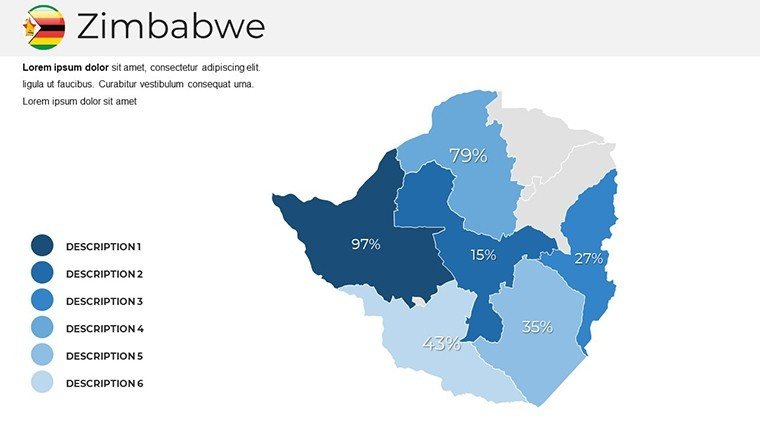
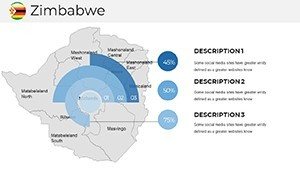
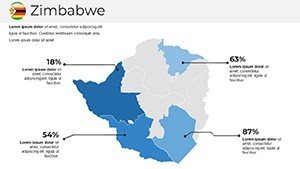
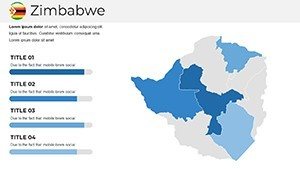
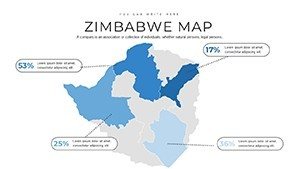
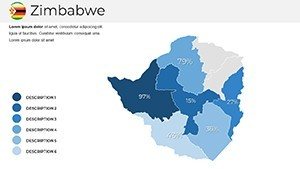
Dive deep with features engineered for impact. The core 36 slides span from panoramic overviews to micro-focused insets, all vector-sharp for endless zooming. Kick off with the national choropleth map, where you can shade provinces by GDP or rainfall, pulling from Excel for live updates that keep your deck dynamic.
Highlighting Heritage and Hotspots
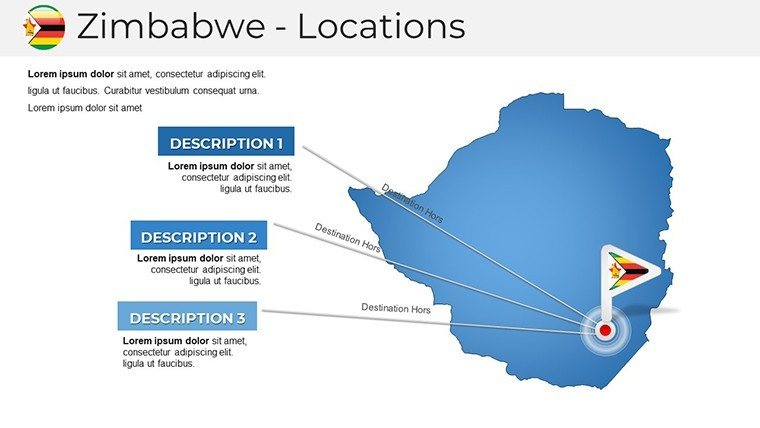
Slide 8 steals the show: A layered map of Victoria Falls, complete with hydrological flows and eco-zones, ready for animations that cascade like the falls themselves. Add callouts for biodiversity stats or tourism revenue, customizing fonts to echo Shona script influences for cultural depth. Then there's the Great Zimbabwe cluster - archaeological site plans with timeline sliders, ideal for educational deep dives or heritage tourism bids.
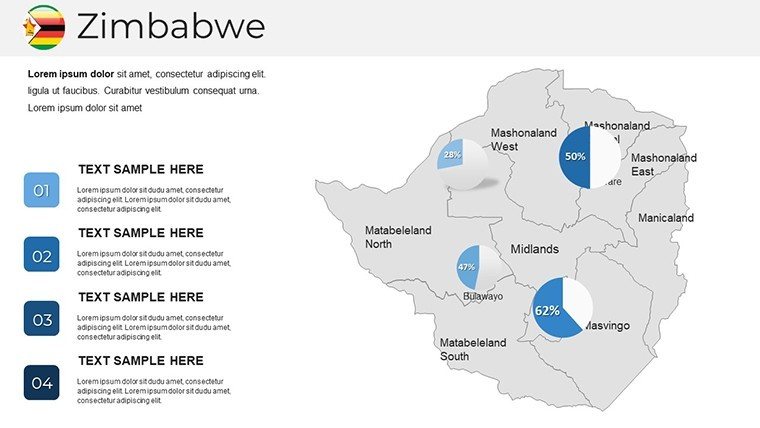
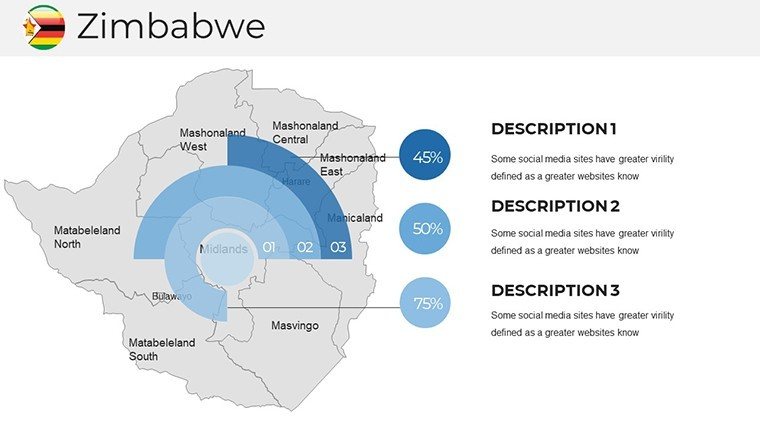
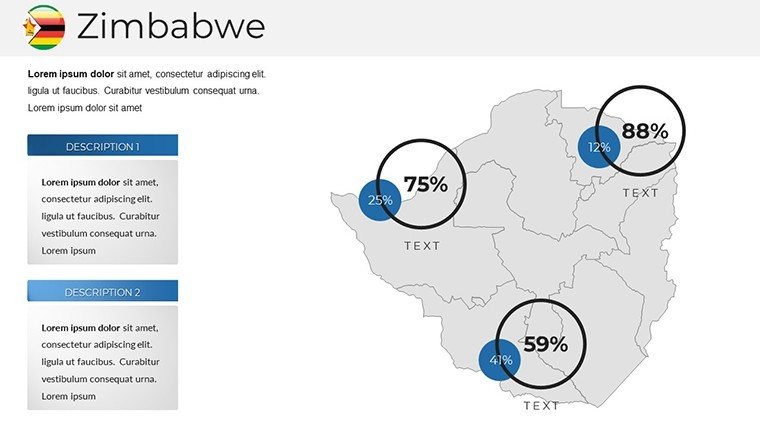
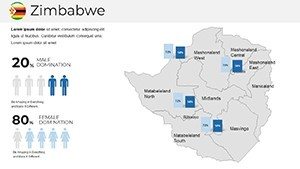
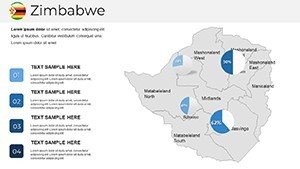
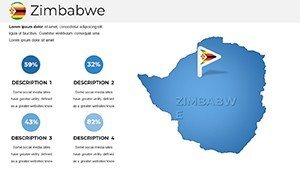
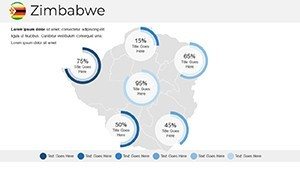
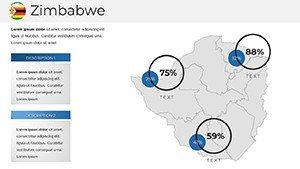
Infographics amplify every map: Pie charts for ethnic distributions, bar graphs for agricultural yields in the Lowveld. With 75+ icons - from elephant silhouettes to tobacco leaf motifs - you'll symbolize data without saying a word. And for the detail-oriented, legends auto-update, ensuring accessibility for color-blind viewers.
Seamless Tweaks for Your Signature Style
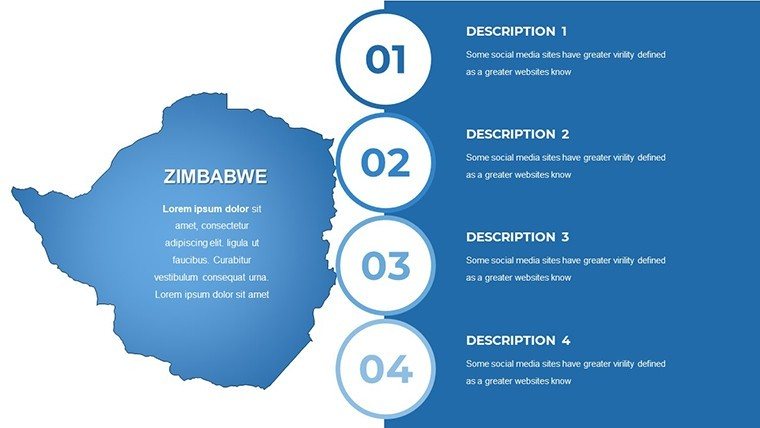
Editing feels like sculpting clay - intuitive and forgiving. Master slides enforce cohesion, with theme colors inspired by the flag's green and gold. Swap in your logo on every footer, or tweak gradients for a sunset-over-Savé Valley vibe. Pro designers appreciate the grouped elements; ungroup for granular control, regroup for speed.
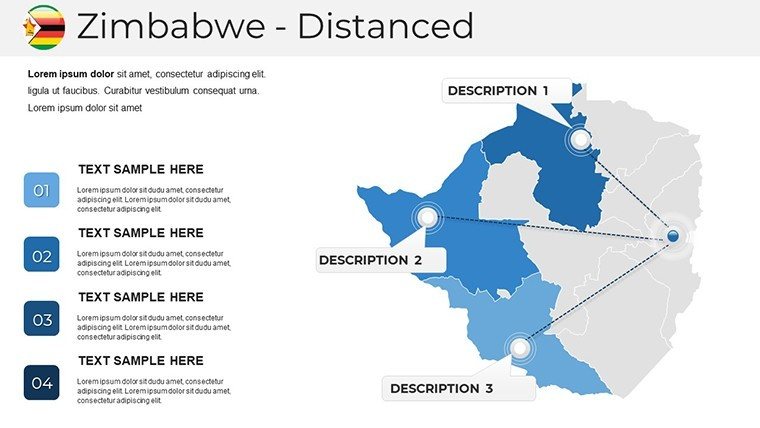
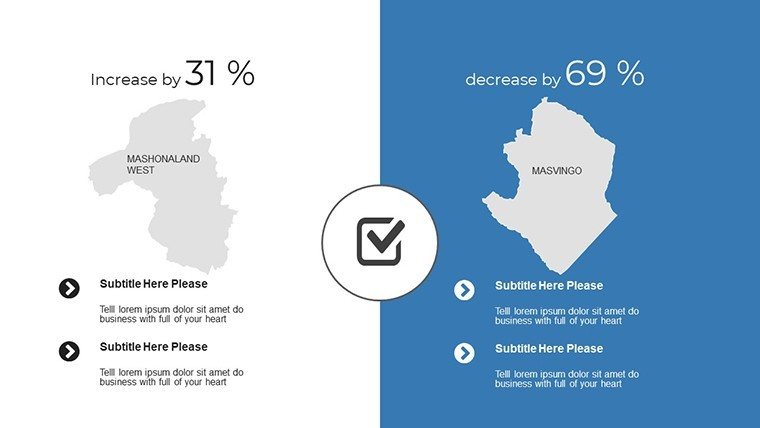
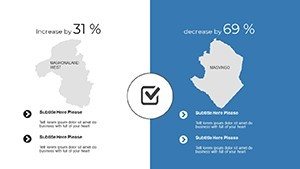
- Interactive Layers: Toggle visibility for multi-scenario views, like pre- vs. post-independence borders.
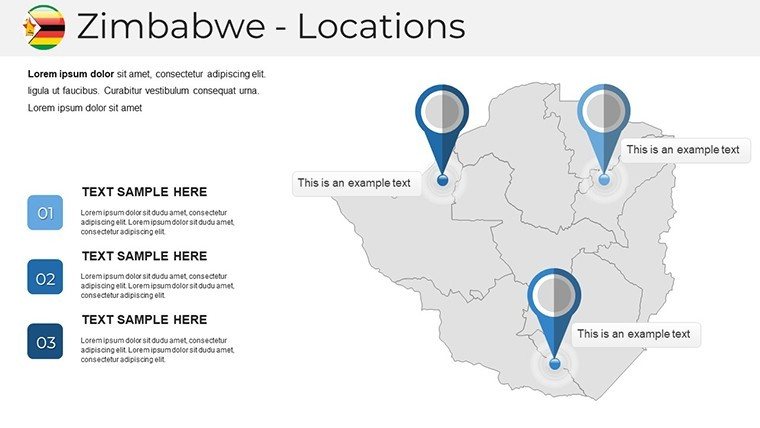
- Data Integration: Smart connectors link maps to adjacent stats blocks.
- Mobile Optimization: Responsive layouts that shine in virtual meetings.
Bonus: For architects, overlay urban growth models on Bulawayo slides - perfect for heritage preservation proposals.
Versatile Use Cases: Powering Diverse Narratives
A university lecturer in Cape Town used slide 20's river basin map to illustrate drought resilience strategies, engaging 200 students with clickable hotspots linking to case studies. The result? A 25% uptick in class participation. Similarly, a Harare marketing agency transformed client pitches by mapping consumer footprints across Manicaland, weaving in social media heatmaps for targeted campaigns.
From Corporate Strategy to Academic Excellence
In the corporate realm, envision a renewable energy pitch: Sequence slides from Kariba Dam's hydro map to wind farm potentials in the Eastern Highlands, with ROI projections fading in sequentially. One exec shared how it clinched a government contract, outshining competitors' text-heavy slogs.
Educators adore the history timeline integration - map colonial rail lines over modern infrastructure to spark debates on development. Researchers? Export segments to reports, maintaining vector quality for publications.
- Research: Populate demographic slides with census pulls.
- Design: Animate conflict zones for geopolitical analyses.
- Deliver: Hyperlink to sources for credibility boosts.
For travel planners, itinerary builders map routes from Hwange to the Zambezi Valley, embedding cost breakdowns that convert browsers to bookers.
The Superiority Edge: Beyond Basic Cartography
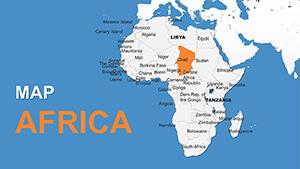
Why settle for Bing Maps screenshots when this template offers forensic fidelity? Updated with 2024 boundary tweaks, it's a trusted ally for pros citing World Bank data. Unlike free alternatives, our infographics are pre-animated, saving you from timeline tinkering.
Testimonials flood in: "Revolutionized our heritage tours," says a Victoria Falls guide. It's not just slides - it's a storytelling scaffold that adapts to your ambition.
Pro Hacks for Peak Performance
Elevate further:
- Contrast backgrounds for map pop - midnight blue for night-sky stargazing slides.
- Incorporate audio cues via embedded narrations for self-guided decks.
- A/B test layouts; our flexibility makes iterations a breeze.
Own the room, one coordinate at a time.
Launch Your Journey: Download and Dominate
Don't let great ideas get lost in the veld. Snag the Zimbabwe Maps PPT Template now and script your success story. Edit, engage, excel - your audience awaits.
Frequently Asked Questions
What makes the infographics in this Zimbabwe template unique?
Them tailored to local motifs, like baobab icons for timelines, blending culture with data for authentic appeal.
Can I integrate live data from external sources?
Yes - link to Google Sheets for auto-refreshing stats on your economic maps.
Is it optimized for virtual presentations?
Definitely; lightweight files and smooth animations ensure lag-free Zoom deliveries.
How accurate are the boundary depictions?
Sourced from official Zimbabwe Surveyor General data, with annual updates for precision.
Does it support multilingual labels?
Editable text fields allow easy swaps to Ndebele, Shona, or English variants.
What's the best way to animate the Victoria Falls slide?
Use path animations for water flow, synced with sound effects for immersive impact.