Currency Exchange PowerPoint Diagrams: Editable PPTX


Type: PowerPoint Diagrams template
Category: Arrows
Sources Available: .pptx
Product ID: PD00138
Template incl.: 15 editable slides
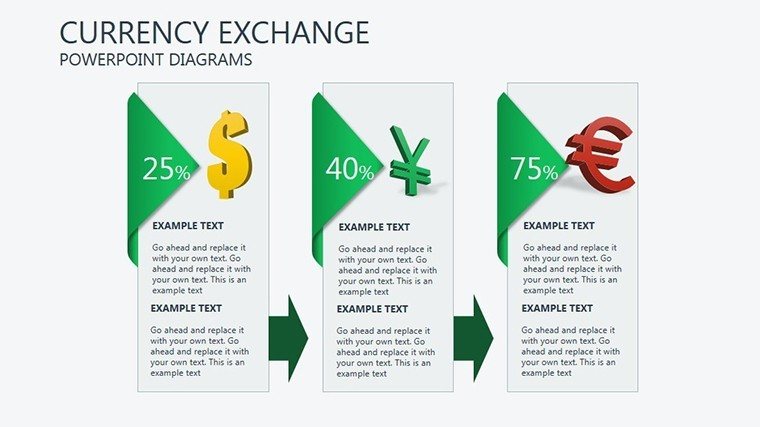
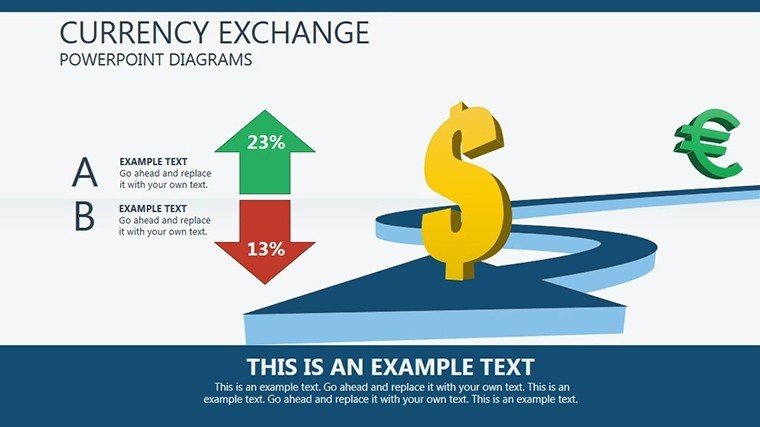
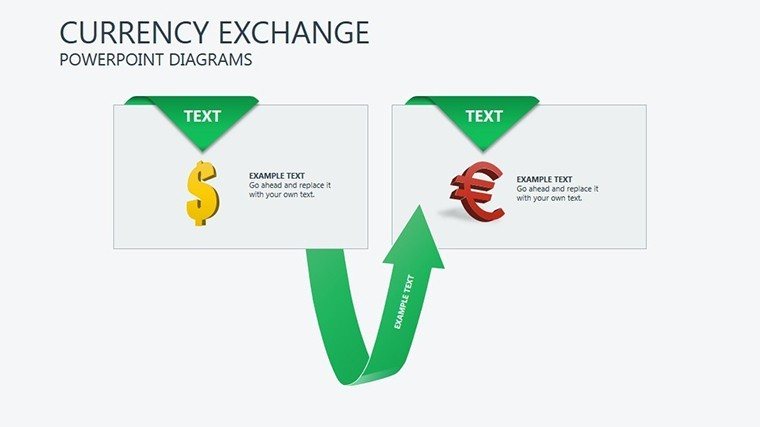
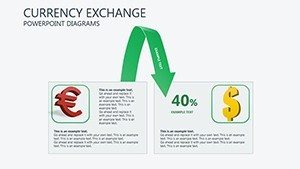
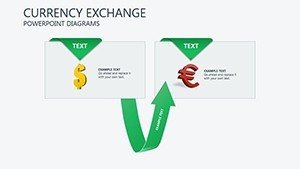
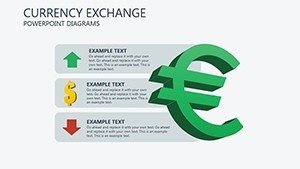
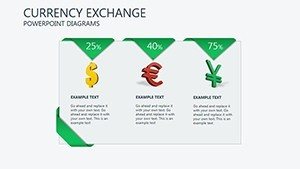
Navigate the intricate world of global finance with our Currency Exchange PowerPoint Diagrams Template. Designed for financial analysts decoding market trends, educators teaching economic principles, or executives presenting international strategies, this set of 15 editable slides demystifies currency dynamics. Rooted in expertise from sources like the International Monetary Fund (IMF) reports, these diagrams visualize exchange rates, pairings, and influencing factors with clarity and flair. Move beyond text-heavy slides to engaging visuals that enhance comprehension and spark discussions.
Consider a trader illustrating volatility: Use arrow-based diagrams to show rate fluctuations, overlaying graphs for historical data. In classrooms, professors can animate currency flows to explain balance of payments, aligning with curricula from institutions like Harvard Business School. The template's value lies in its ability to transform abstract concepts into tangible insights, saving preparation time while boosting audience retention.
Standout Features for Financial Mastery
Each diagram boasts intuitive layouts, with editable arrows and nodes for flexible storytelling. Fully compatible with PowerPoint and Google Slides, they support data-driven customizations.
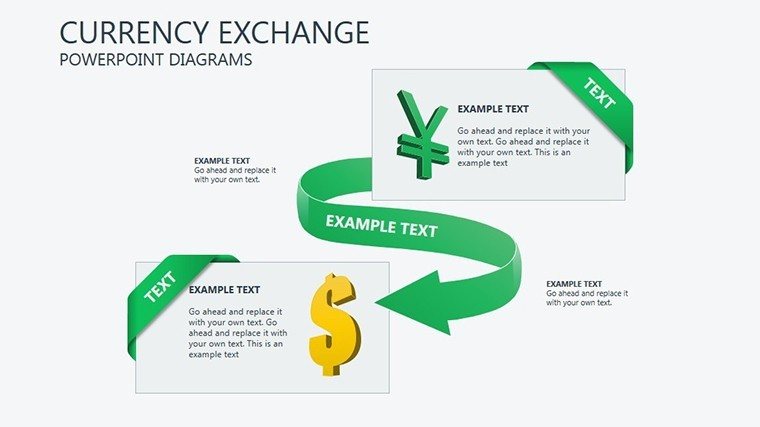
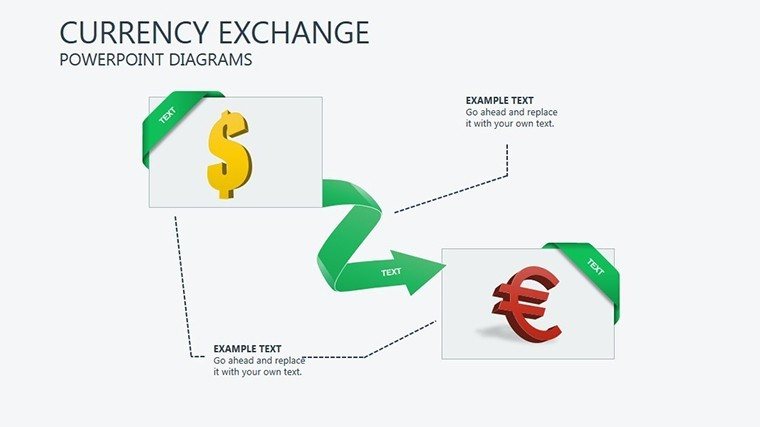
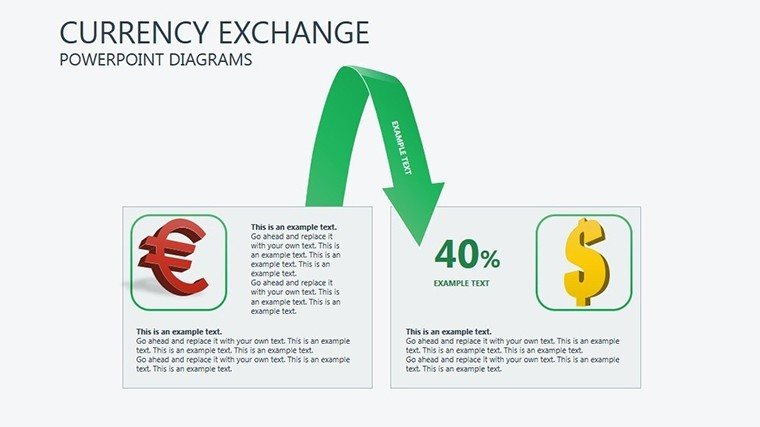
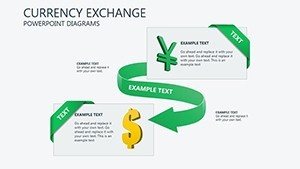
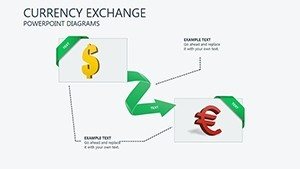
- Dynamic Arrow Diagrams: Represent currency flows and conversions with adjustable paths.
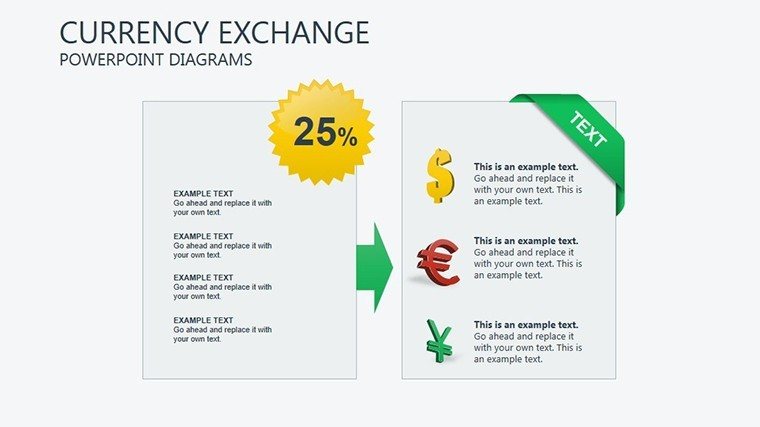
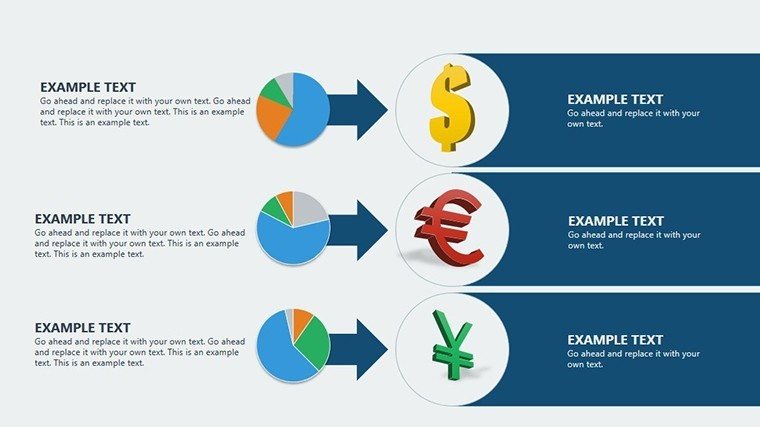
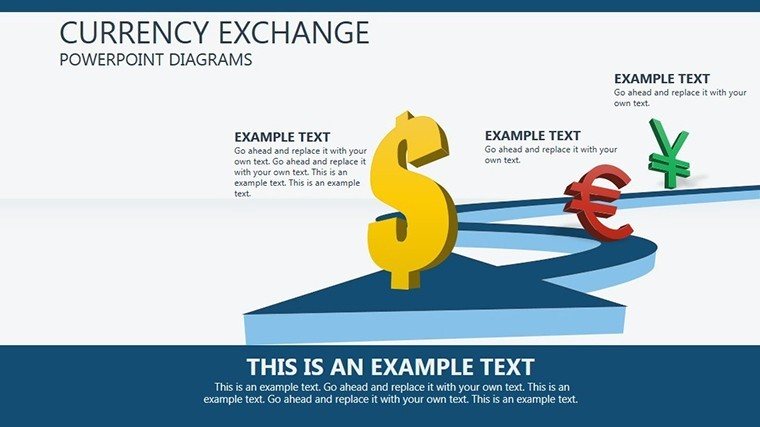
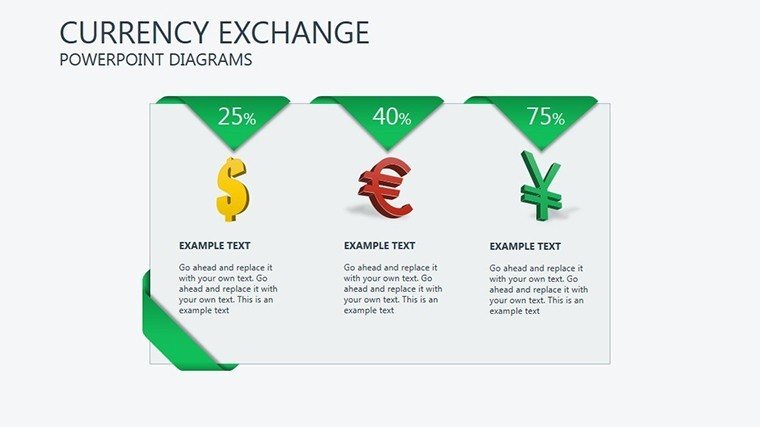
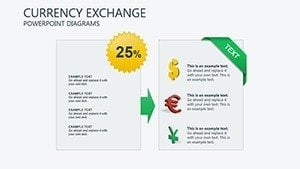
- Color-Coded Pairings: Highlight major pairs like EUR/USD with thematic hues for quick recognition.
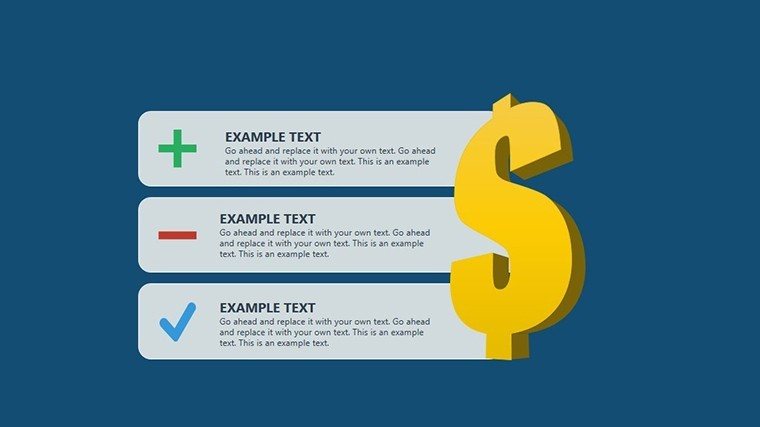
- Editable Layouts: Resize, recolor, or add elements to fit your analysis.
- Integration Ready: Link to Excel for live data updates on rates.
- Versatile Themes: Adapt for topics from hedging to economic impacts.
These draw from authoritative financial modeling techniques, ensuring reliability.
Practical Use Cases in Finance
For market analysts, slide 8's exchange rate timeline helps forecast trends, incorporating real-time data as in Bloomberg terminals. Entrepreneurs pitching to investors might use slide 12 to depict risk management, showcasing how currency hedges protect profits - echoing strategies from successful startups like TransferWise.
In corporate training, HR uses these to educate on international trade effects, with interactive elements fostering engagement. Unlike rudimentary charts, this template offers pre-built complexity, cutting design effort significantly.
Guide to Building Your Diagrams
- Choose a base diagram slide matching your topic.
- Input data: Edit labels with current rates or projections.
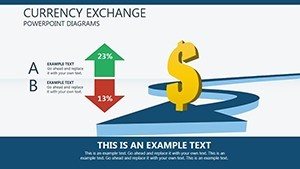
- Customize visuals: Adjust colors for emphasis on gains/losses.
- Add interactivity: Hyperlink to sources like IMF databases.
- Animate sequences: Reveal factors influencing rates step-by-step.
- Finalize: Export for sharing or printing.
This mirrors efficient workflows in financial consulting firms.
Advantages Over Basic Tools
Default PowerPoint lacks the specialized arrows for flows; ours provide them with economic icons for added context. Trust builds through compliance with data visualization best practices from experts like Edward Tufte. Add a touch of wit: Watch your audience 'exchange' boredom for interest with animated trades.
Enhancing Your Financial Workflow
Embed APIs for real-time rates or link to news feeds. Google Slides compatibility aids global teams. At $26, it's an investment in clarity, with updates for evolving markets.
Transform your currency insights today - download and exchange ideas powerfully.
Frequently Asked Questions
- How customizable are these diagrams?
- Fully editable, including shapes, colors, and data integration.
- Compatible with Google Slides?
- Yes, for collaborative financial work.
- Suitable for commercial use?
- Yes, ideal for business and educational purposes.
- File format?
- .pptx, ready for immediate editing.
- Include data examples?
- Placeholders for easy customization with real data.