SEO PowerPoint Diagrams for Optimization


Type: PowerPoint Diagrams template
Category: Illustrations
Sources Available: .pptx
Product ID: PD00207
Template incl.: 13 editable slides
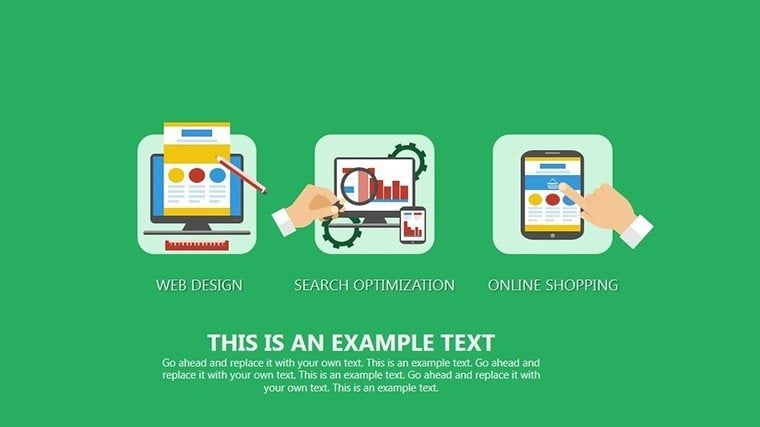
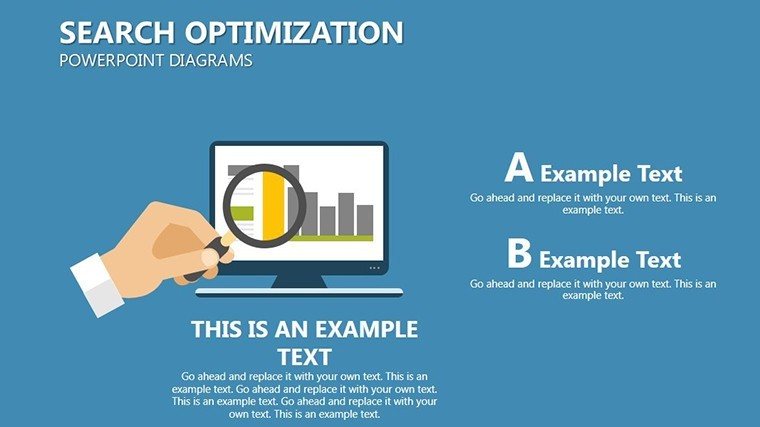
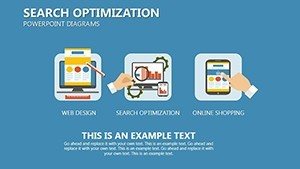
In the ever-evolving realm of digital marketing, effective SEO isn't just about keywords � it's about crafting content that resonates and ranks. Our Effective Search Optimization PowerPoint diagrams template is designed for marketers, content creators, and SEO specialists seeking to visualize strategies that boost website traffic and conversions. With 13 editable slides, it simplifies complex topics like keyword integration, content engagement, and visual data representation.
Based on guidelines from authoritative sources like Google's Search Central, this template incorporates best practices for hierarchy diagrams and flowcharts. Compatible with PowerPoint on all platforms, it allows effortless customization, ensuring your presentations are as dynamic as your SEO plans.
Features That Drive SEO Success
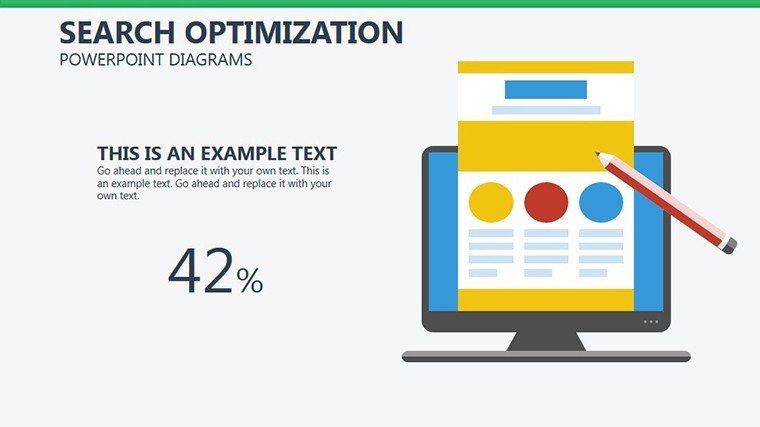
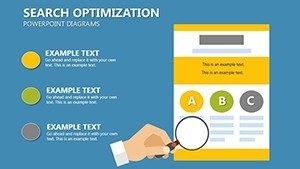
Slide 1 introduces a keyword ecosystem diagram, mapping search terms to content pillars. Themed in strategic greens and yellows for growth symbolism, but fully editable, these outpace default tools with SEO-specific elements like SERP simulations.
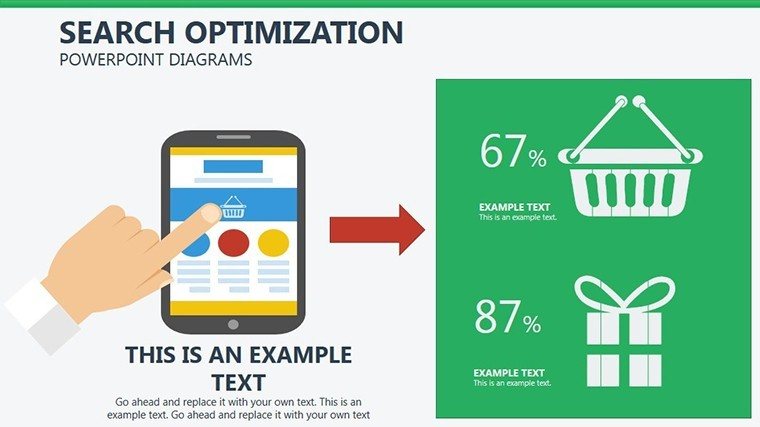
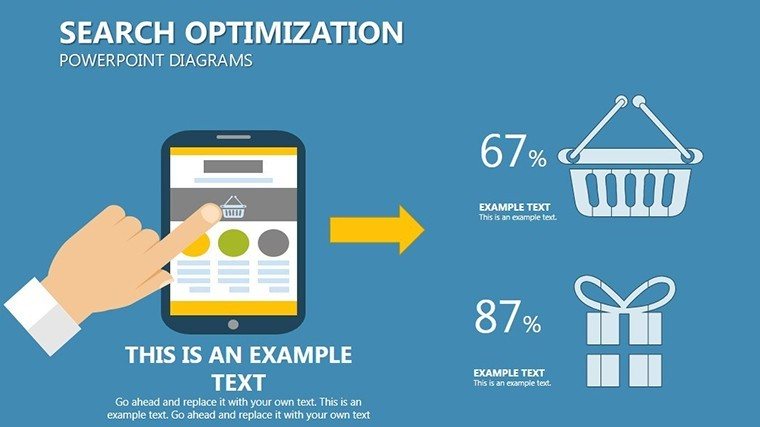
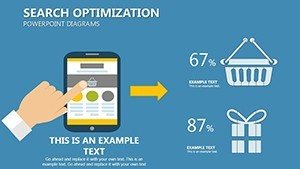
Key benefits: Enhanced clarity, as Moz studies show visuals improve SEO comprehension. For an e-commerce site, Slide 8's process diagram can outline optimization workflows, addressing issues like low engagement.
Highlighted Diagram Tools
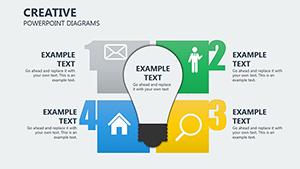
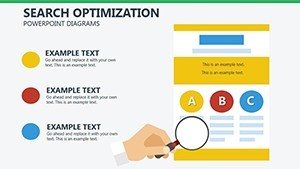
- Keyword Clusters: Group terms for targeted content planning.
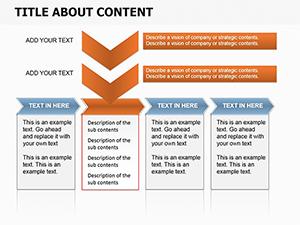
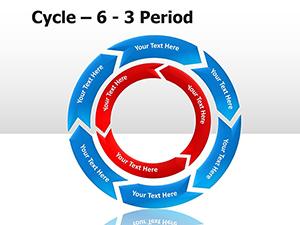
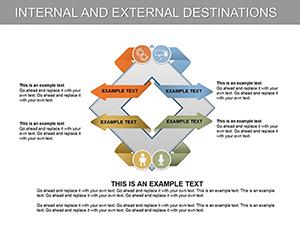
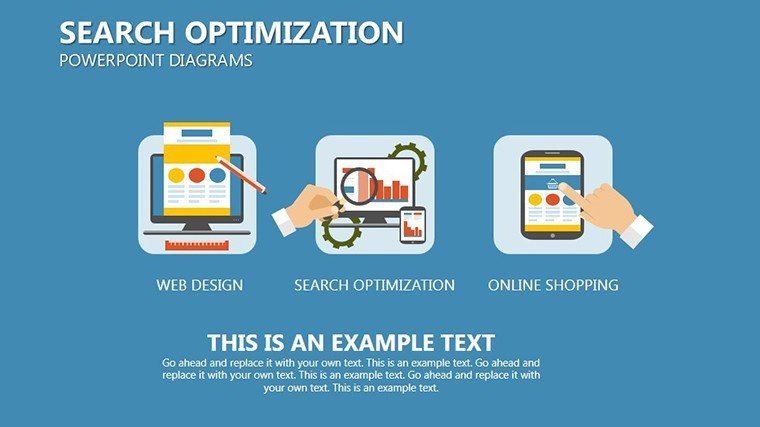
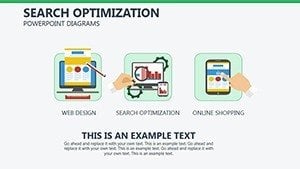
- Content Flows: Map user journeys from search to conversion.
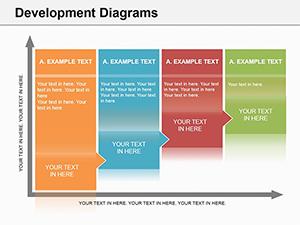
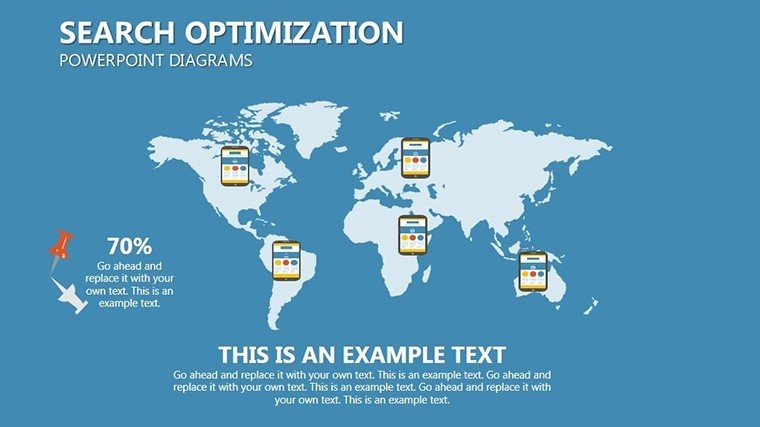
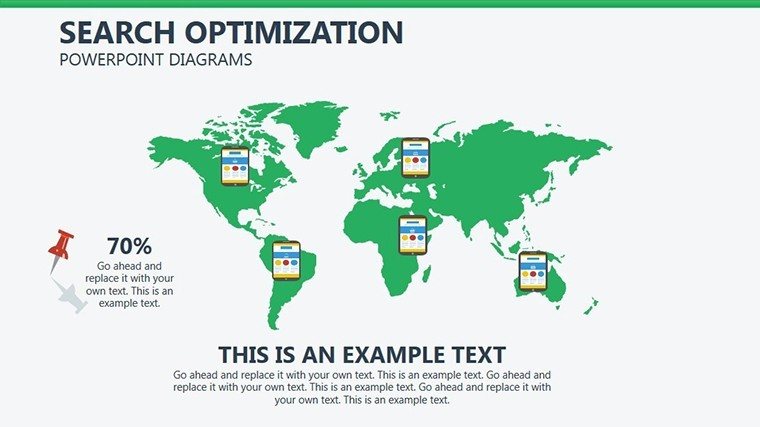
- Hierarchy Views: Structure site architecture for crawl efficiency.
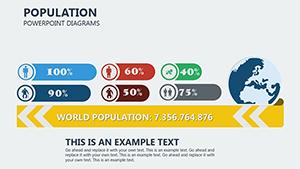
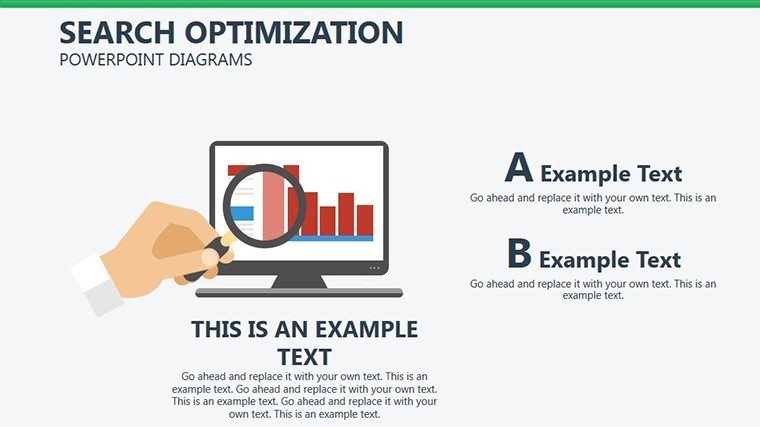
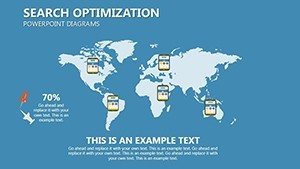
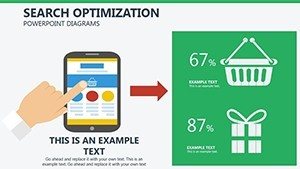
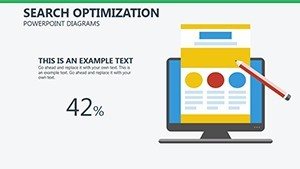
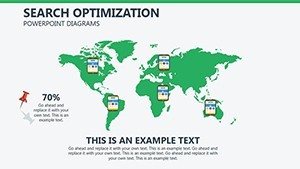
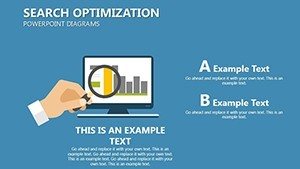
- Statistic Graphs: Display metrics like bounce rates visually.
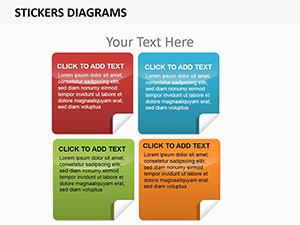
- Caption Integrations: Embed keywords naturally in descriptions.
These align with E-A-T principles, showcasing your expertise through data-backed visuals.
Strategic Use Cases in Digital Marketing
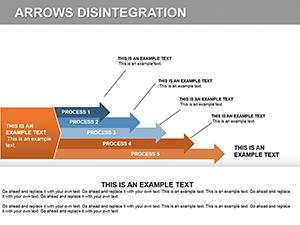
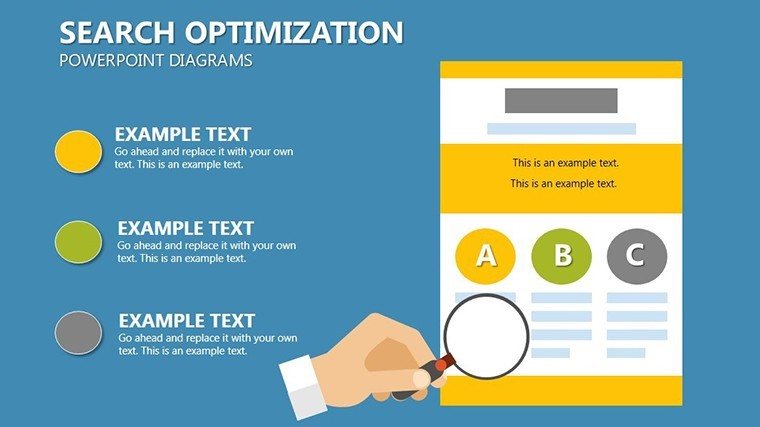
For client pitches, Slide 11's engagement pyramid illustrates content value. In team meetings, Slide 5's flowchart details keyword research steps.
Usage guide: Open .pptx, populate Slide 3's grid with your keywords, customize visuals. This combats thin content by providing robust frameworks. Better than generics, it includes accurate, relevant placeholders.
Example: Agencies like SEMrush use similar diagrams in webinars to educate on SEO, driving higher adoption rates.
Optimization Tips from SEO Veterans
- Research thoroughly: Use tools like Ahrefs for authentic keyword data.
- Avoid stuffing: Integrate terms organically in diagrams.
- Value audience: Address pain points with targeted visuals.
- Update regularly: Refresh diagrams with current trends.
- Measure impact: Track presentation feedback for refinements.
Sourced from successful campaigns, these ensure trustworthy, high-performing outputs.
Boost Your SEO Game � Secure the Template
Harness the power of visuals to elevate your SEO strategies. Download now and start optimizing with confidence.
Frequently Asked Questions
- How do I incorporate keywords into diagrams?
- Naturally in titles, captions, and labels for organic flow.
- Compatible with Mac PowerPoint?
- Yes, seamless on all versions.
- Can diagrams handle complex data?
- Yes, scalable for stats and hierarchies.
- Ideal for beginners?
- Absolutely, intuitive with guides.
- Export options available?
- To images, PDFs, and more.