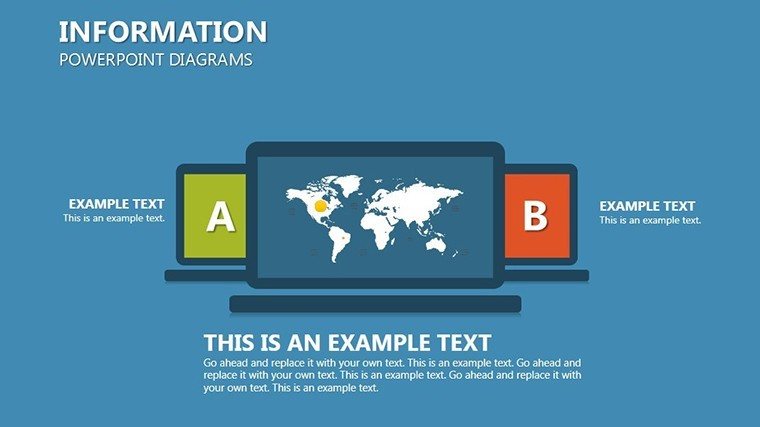
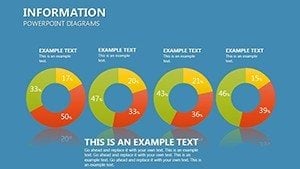
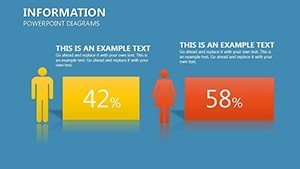
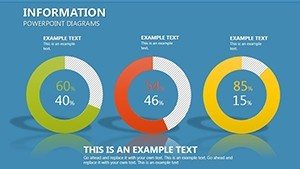
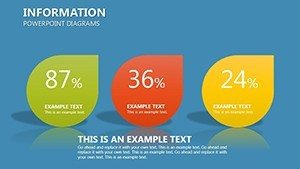
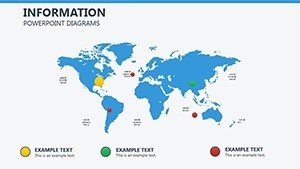
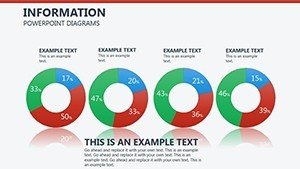
Information PowerPoint Diagrams: Clarity in Every Curve


Type: PowerPoint Diagrams template
Category: Analysis
Sources Available: .pptx
Product ID: PD00205
Template incl.: 26 editable slides
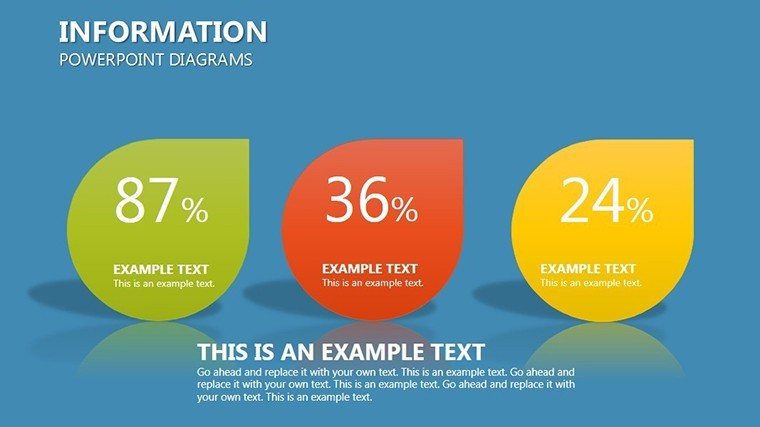
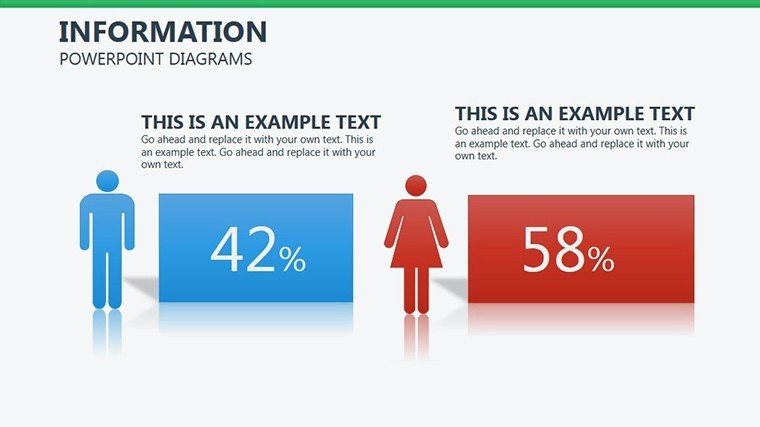
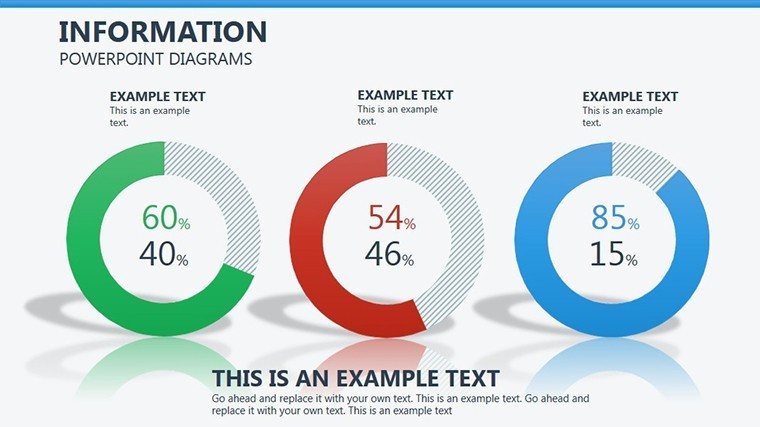
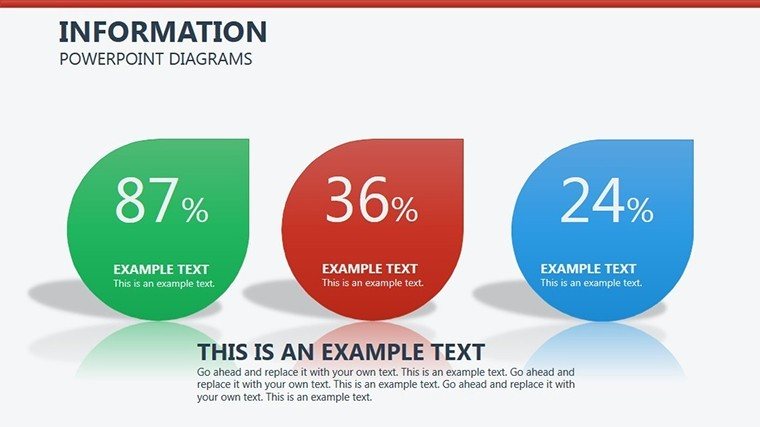
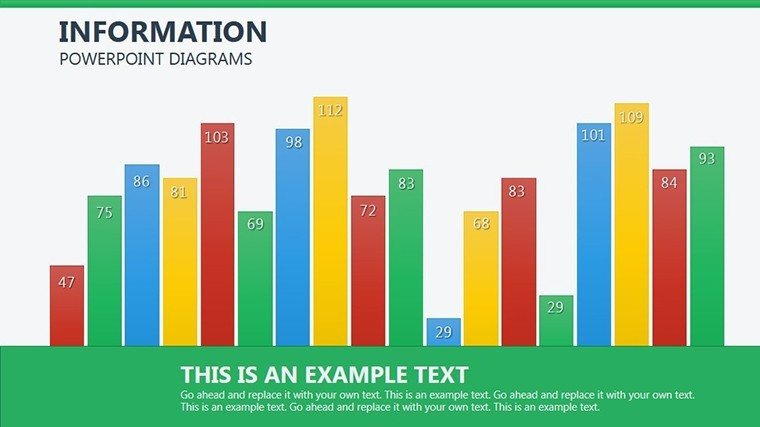
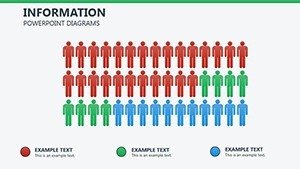
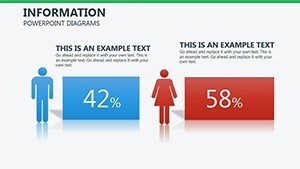
Ever stared at a spreadsheet of quarterly metrics, wondering how to make it sing instead of drone? Enter our Information PowerPoint Diagrams template, a robust collection of 26 editable slides that turns the mundane into mesmerizing. Tailored for corporate executives, educators, and data-driven entrepreneurs, this toolkit is your ally in decoding intricate datasets - from revenue forecasts to operational workflows - into visuals that captivate and convince. Whether you're dissecting market trends for a high-stakes pitch or illustrating lesson plans with elegant flowcharts, these diagrams bridge the gap between numbers and narratives, ensuring your message lands with precision and panache.
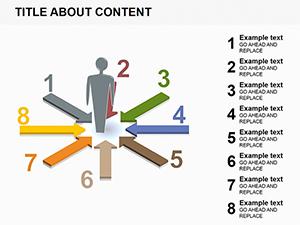
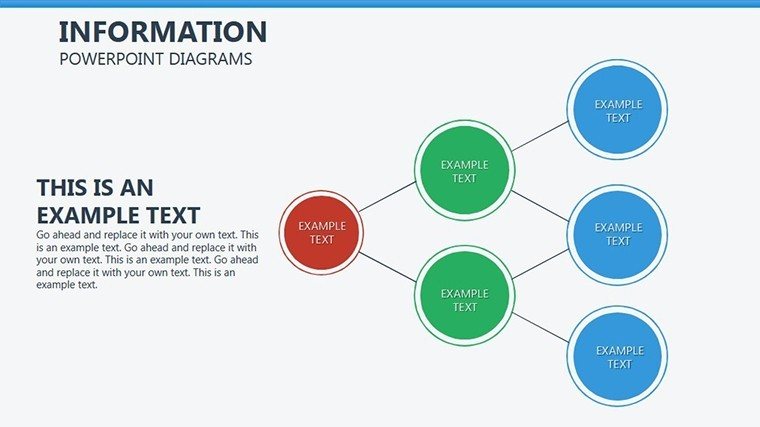
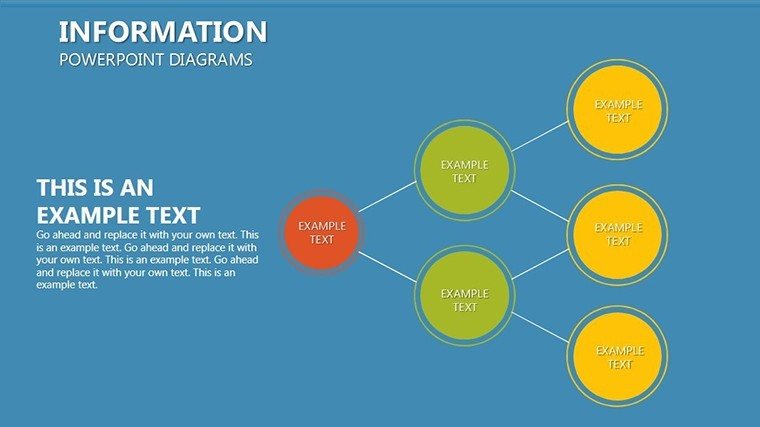
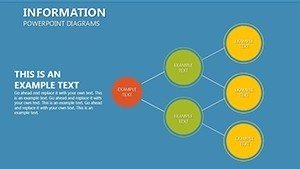
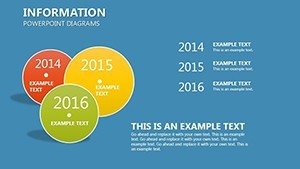
In an era where information overload is the norm, standing out means wielding tools that distill complexity without dumbing it down. Our template, inspired by best practices from analytics powerhouses like Tableau integrations, offers unparalleled versatility: Think radial org charts for team structures or layered Venn diagrams for overlapping strategies, all primed for your unique spin. Compatible across PowerPoint versions and Google Slides, it empowers seamless edits - tweak hues to echo your company's palette, or embed live data links for real-time updates during virtual meets. The result? Presentations that not only inform but ignite discussions, much like how TED speakers use similar visuals to unpack global challenges with effortless grace.
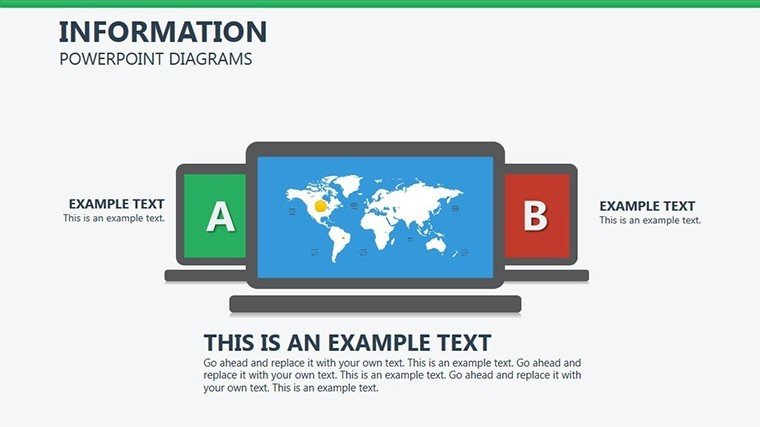
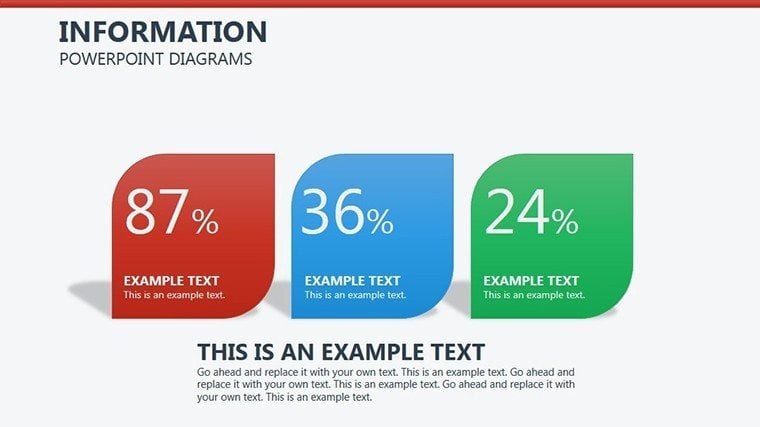
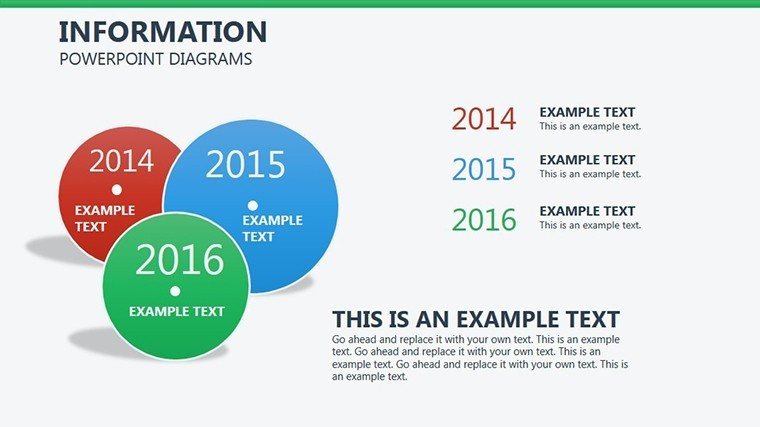
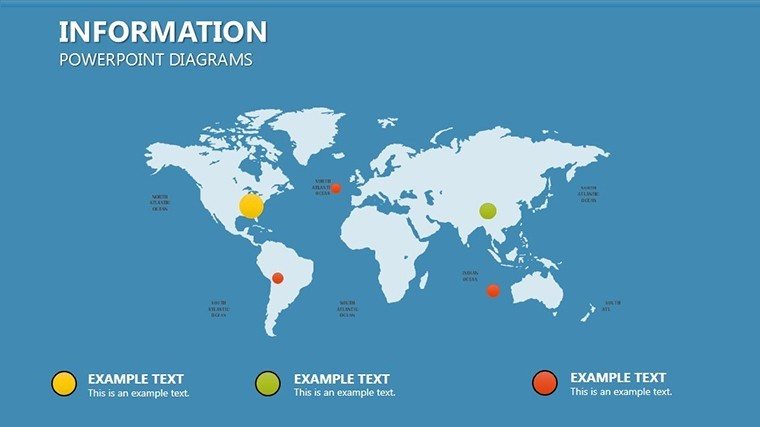
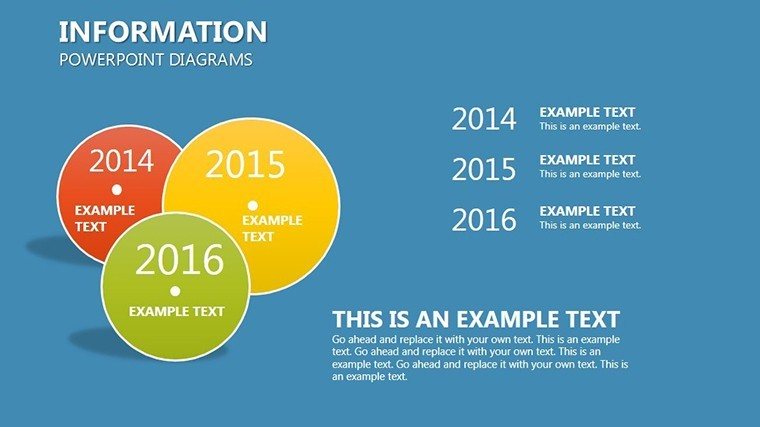
What elevates this beyond basic templates is its commitment to accessibility and professionalism. Slide #0 serves as a gateway with a minimalist dashboard overview, aggregating key indicators into a glanceable grid that's ideal for executive summaries. As you navigate to Slide #13's timeline variant, you'll find animation-ready sequences for project milestones, complete with milestone markers that auto-adjust to your dates. For architecture enthusiasts applying data viz to sustainable builds, adapt Slide #8's scatter plots to map material efficiencies against environmental impacts, aligning with LEED certification visuals that pros swear by.
Standout Features: Engineered for Insightful Impact
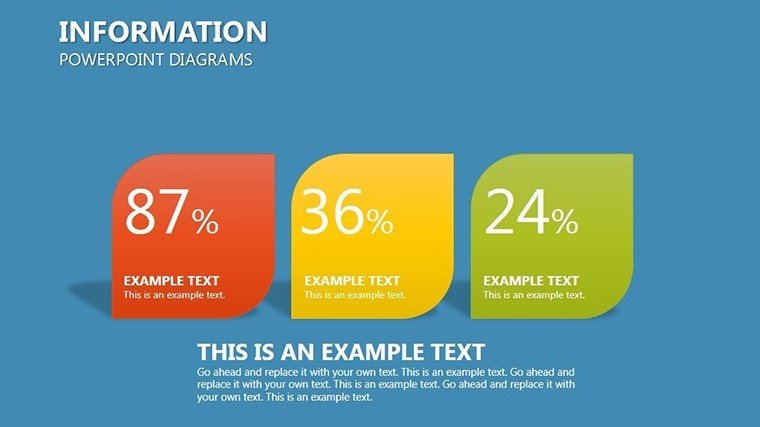
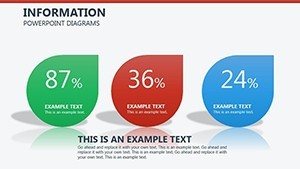
Diving into the nuts and bolts, our Information PowerPoint Diagrams boast features that prioritize both form and function. The professional design ethos - courtesy of seasoned graphic experts - ensures layouts that are as intuitive as they are aesthetically pleasing, with ample white space to prevent cognitive clutter.
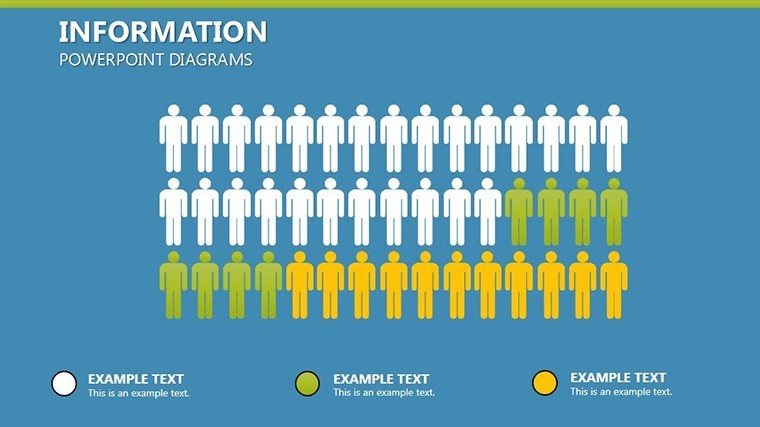
- Theme-Spanning Versatility: From corporate KPIs to educational breakdowns, these slides flex across contexts without losing coherence.
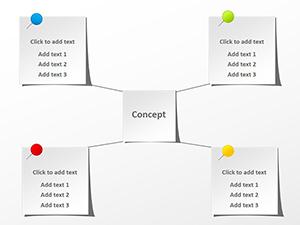
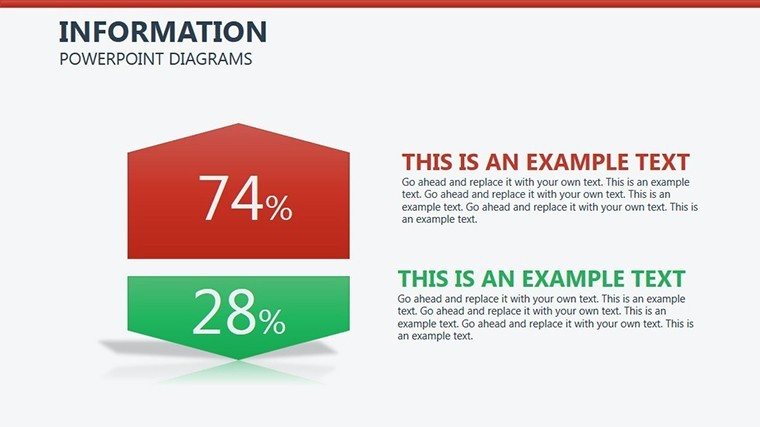
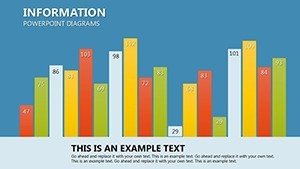
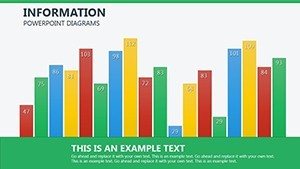
- Effortless Customization: Modify components like node sizes in mind maps or gradient fills in bar series, all via intuitive right-click menus.
- Integration Magic: Plug into existing decks with drag-and-drop ease, preserving your narrative flow while amplifying visual punch.
Time savings are baked in: What might take hours in scratch builds condenses to minutes, freeing you for deeper analysis. Consultants at firms like Deloitte echo this, noting how such templates streamline client deliverables, often cutting revision cycles in half.
Step-by-Step Mastery: From Blank Canvas to Boardroom Ready
Envision updating stakeholders on R&D progress. Begin with Slide #4's Gantt-inspired bar, importing CSV timelines to auto-populate durations and dependencies - a boon for project managers juggling multi-phase initiatives.
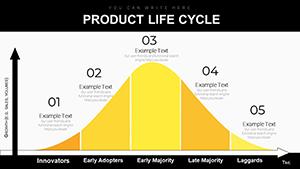
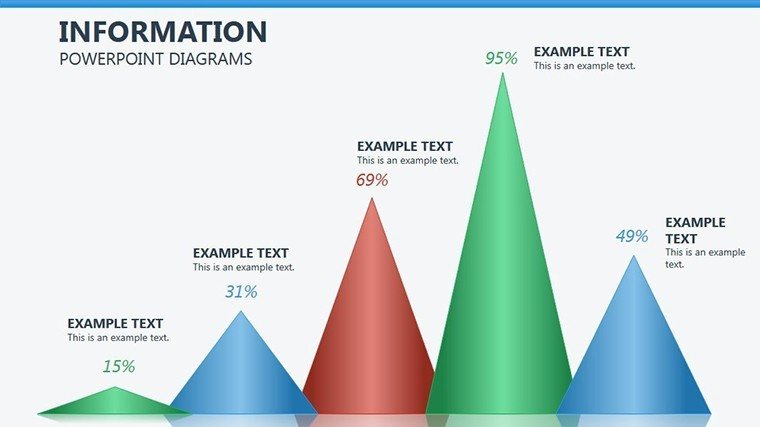
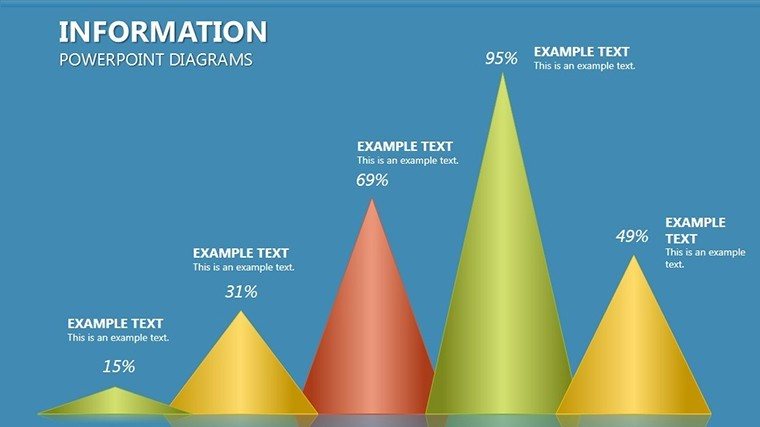
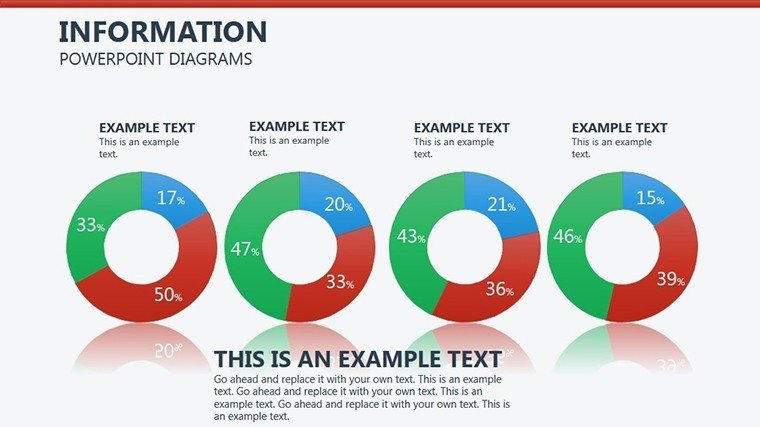
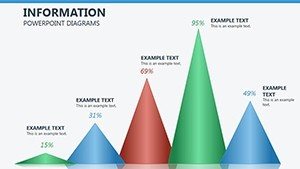
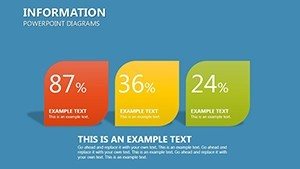
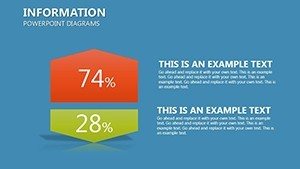
- Assess and Select: Scan your data story; choose from pyramid hierarchies for priority stacks or bubble charts for correlation clusters.
- Infuse and Refine: Layer in annotations with callout shapes, ensuring each visual tells a micro-story, like "Q3 spike tied to seasonal demand."
- Polish and Present: Apply subtle transitions for guided reveals, then export variants for hybrid audiences - full decks for in-person, key slides for email teases.
This workflow has powered countless workshops, where trainers leverage Slide #20's quiz-integrated infographics to test comprehension on the fly, fostering interactive learning loops.
Dynamic Applications: Where Data Meets Destiny
Versatility is the name of the game here. In business meetings, deploy Sankey flows in Slide #16 to trace budget allocations, revealing inefficiencies with river-like clarity - perfect for finance leads advocating reallocations. Entrepreneurs pitching to VCs might spotlight Slide #22's SWOT matrix, populating quadrants with market research pulls to underscore competitive moats.
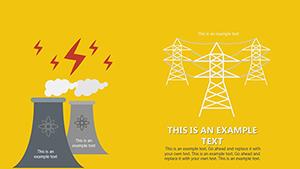
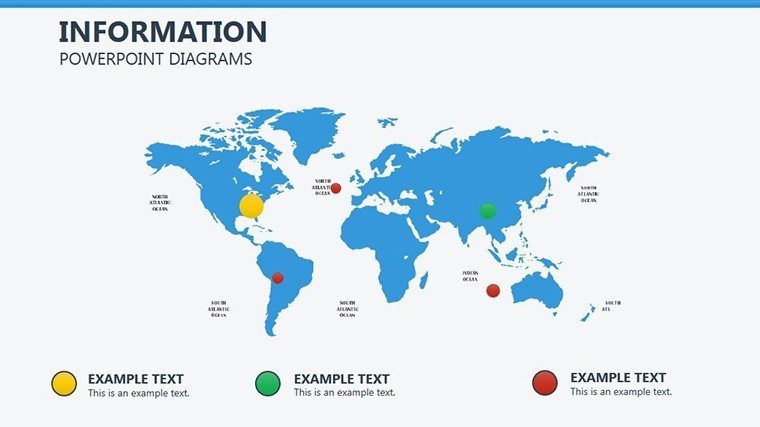
Educators find gold in the instructional variants: Use cycle diagrams for scientific processes, editable to fit curricula from biology evolutions to economic cycles. For a design-forward angle, architects visualizing site analyses can repurpose heat map slides to overlay zoning data, echoing AIA guidelines for transparent stakeholder comms.
Reporting shines too - data analysts at NGOs have transformed annual impacts via these, with editable legends ensuring inclusivity across global teams.
Expert Hacks for Peak Performance
Pro tip: Pair diagrams with alt text for accessibility, boosting SEO on shared platforms while honoring diverse audiences. Versus stock PowerPoint, our pre-vetted color contrasts (WCAG-compliant) eliminate guesswork, delivering diagrams that pop on any screen. Vary scales thoughtfully - logarithmic for exponential growths - to avoid misleading perceptions, a nuance straight from stats pros.
Seize the moment: Grab your Information PowerPoint Diagrams now and architect presentations that don't just share data - they shape decisions. Your insights deserve the spotlight.
Frequently Asked Questions
What themes does this template cover?
It spans corporate statistics, instructional info, and more, with 26 slides adaptable to pitches, reports, and lectures.
How easy is integration with existing presentations?
Super simple - copy-paste slides maintain formatting, and data links update dynamically for live sessions.
Are the designs accessible for beginners?
Yes, with clear layouts and tooltips, even novices can customize without a steep learning curve.
Can I use it for educational purposes?
Definitely - ideal for lectures and workshops, with visuals that enhance retention through structured storytelling.
What's the compatibility like?
Fully works with PowerPoint 2016+ and Google Slides, ensuring cross-platform reliability.
How does it save time compared to building from scratch?
Ready-to-use elements cut creation time by up to 70%, focusing your energy on content over cosmetics.