Oil Industry PowerPoint Diagram Template: Fuel Your Energy Presentations


Type: PowerPoint Diagrams template
Category: Process, Illustrations
Sources Available: .pptx
Product ID: PD00170
Template incl.: 11 editable slides
In the high-stakes world of energy, where every barrel counts and global shifts can rewrite fortunes overnight, your presentations need to drill down to the essentials. Enter our Oil Industry PowerPoint Diagram Template - a compact yet potent 11-slide collection tailored for engineers, analysts, and executives navigating the crude complexities of petroleum markets. This isn't your average chart pack; it's a strategic toolkit that maps out supply chains, integration effects, and performance metrics with the precision of a seismic survey.
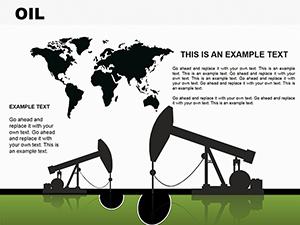
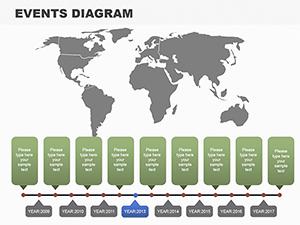
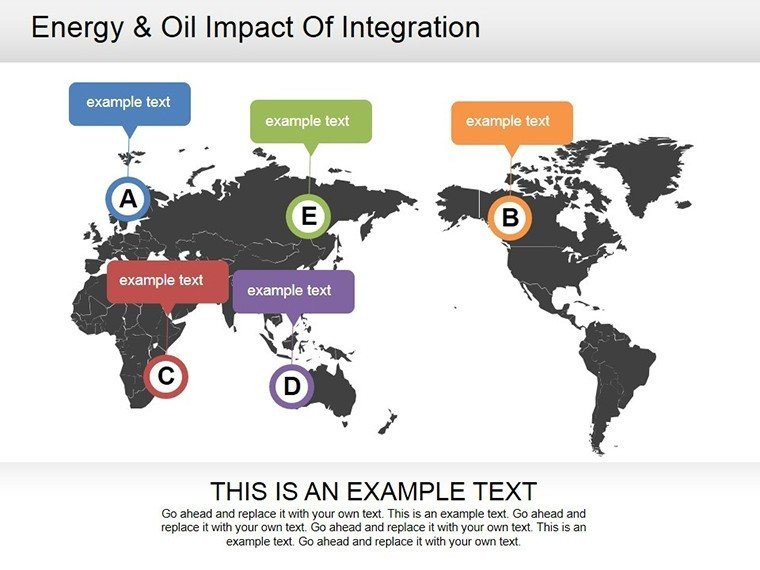
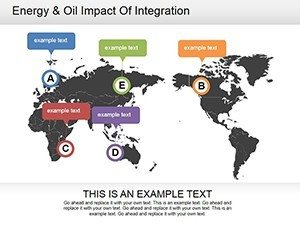
Designed for PowerPoint enthusiasts who demand more than pie charts, this template shines with an editable world map that lets you highlight hotspots like OPEC nations or emerging shale plays. Imagine overlaying production data on interactive regions, revealing how geopolitical tensions ripple through prices - a visual edge that could sway investors during quarterly reviews. We've drawn from real-world applications, like those used in ExxonMobil-style reports, to ensure your slides resonate with industry insiders who value data-driven narratives over fluff.
With full editability, swap in your latest EIA forecasts or customize color schemes to match your company's branding, all while maintaining crisp vectors that pop on projectors or screens. For teams racing against deadlines, this template cuts prep time in half, freeing you to focus on the big picture: sustainable energy transitions and beyond.
Standout Features for Energy Sector Pros
Why settle for static spreadsheets when you can have dynamic diagrams? Our template packs features that anticipate the rigors of oil and gas reporting.
- Interactive World Map: Pinpoint regions with drag-and-drop markers, embed hyperlinks to detailed reports, and animate flows to show export routes vividly.
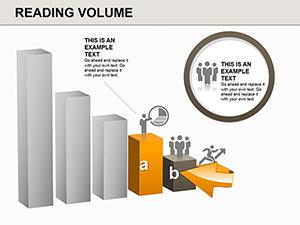
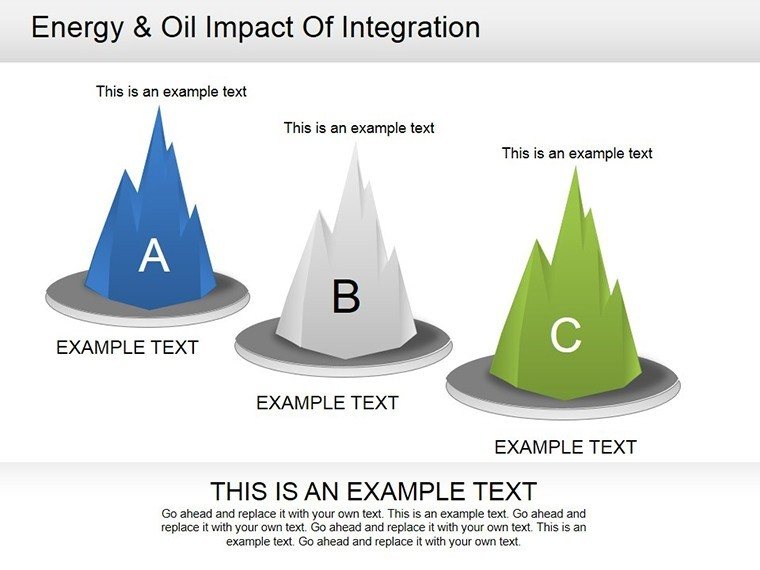
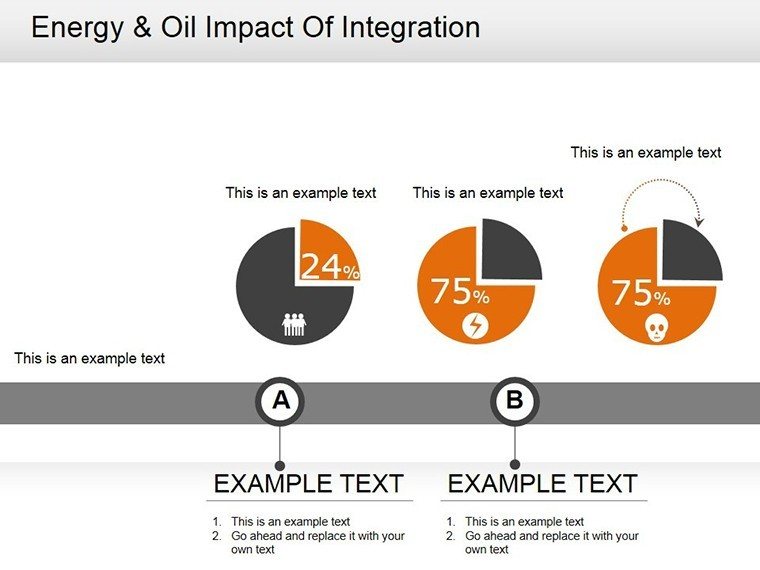
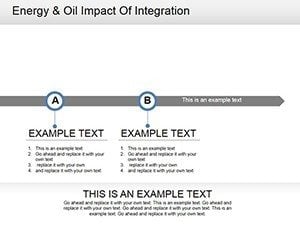
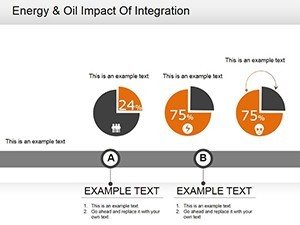
- Data Comparison Tools: Side-by-side bar graphs and scatter plots for juxtaposing output vs. demand, spotlighting extremes like peak oil events.
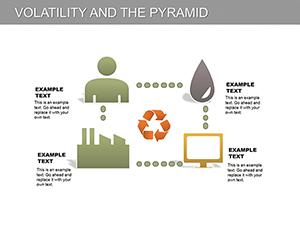
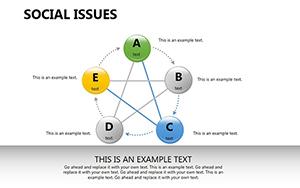
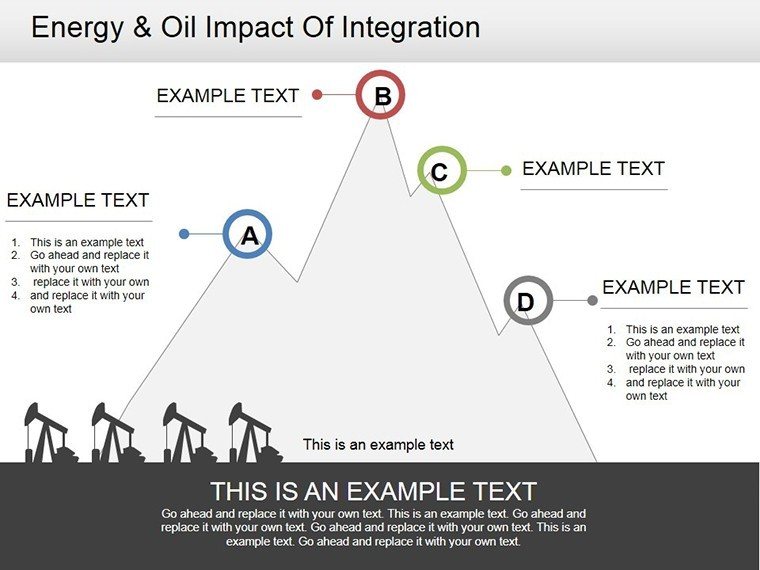
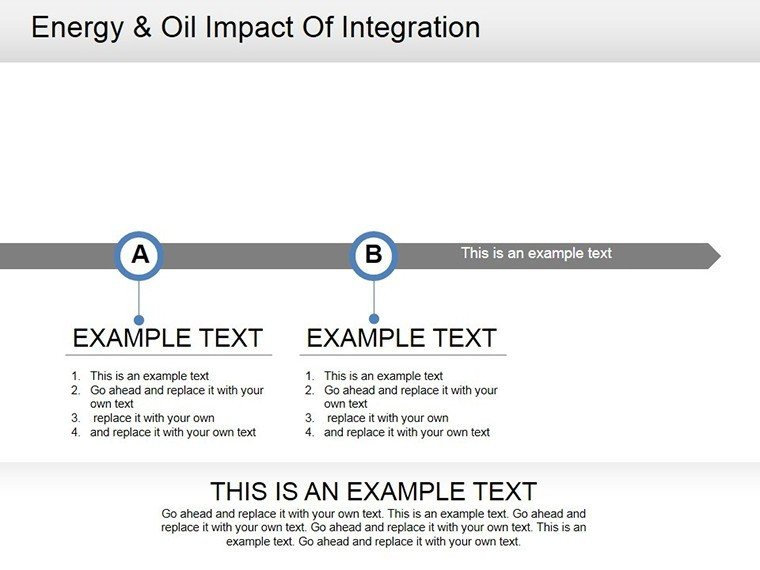
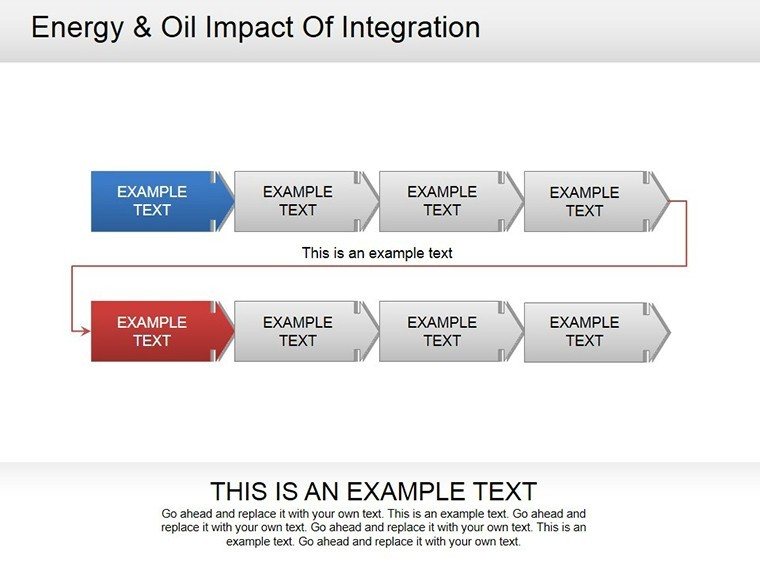
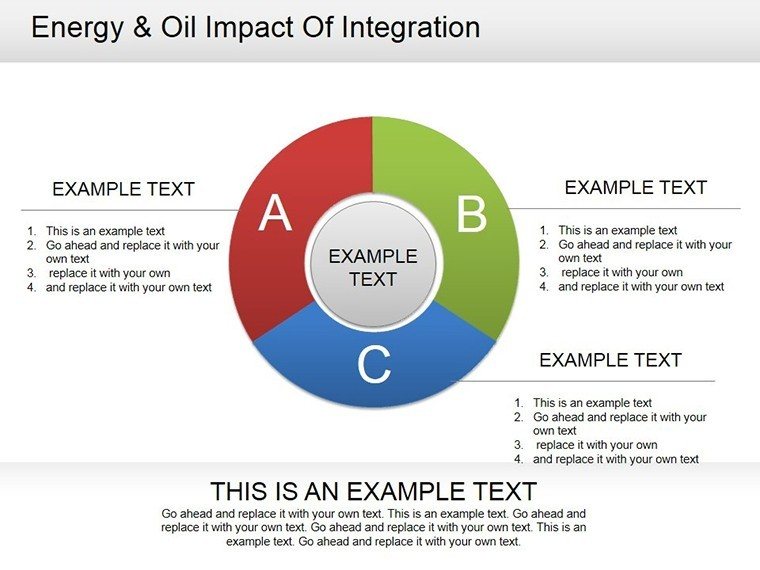
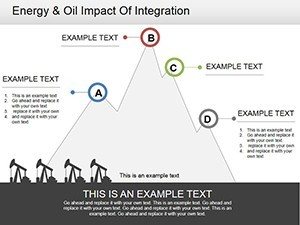
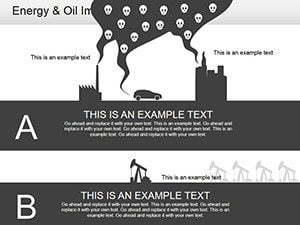
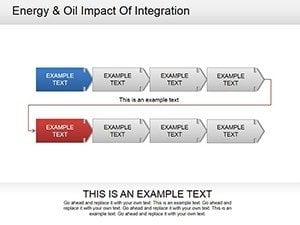
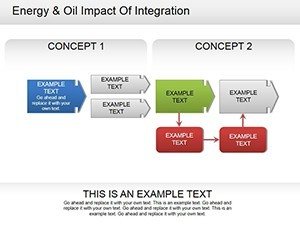
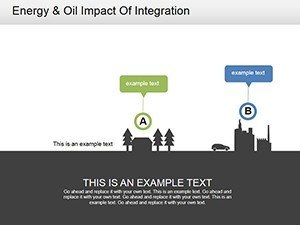
- Impact Visualization: Flowcharts tracing integration effects, from upstream drilling to downstream refining, with customizable nodes for scenario modeling.
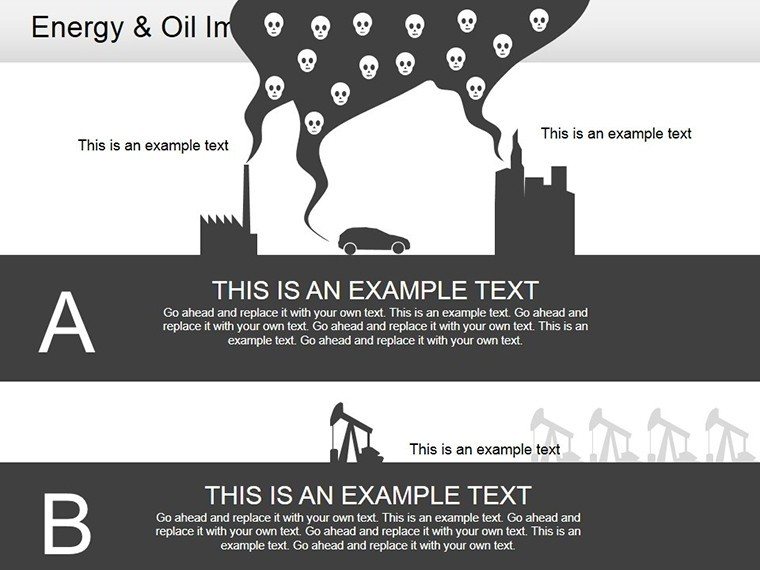
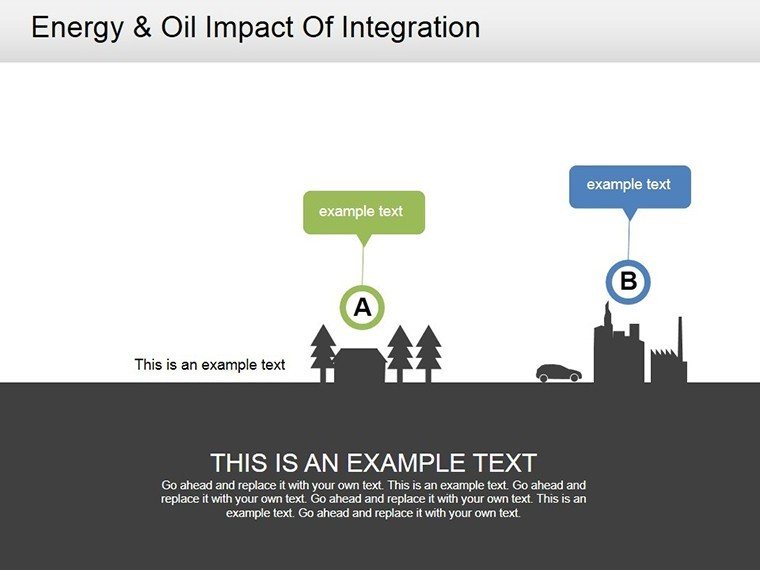
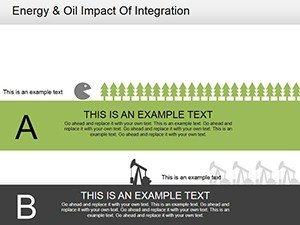
- High-Res Illustrations: Thematic icons (rigs, pipelines, barrels) that scale without loss, adding authenticity without overwhelming the layout.
Unlike basic PowerPoint inserts, which blur under zoom, these elements are optimized for 4K displays and mobile views - essential for field engineers sharing on-the-go updates.
Real-World Applications: From Boardrooms to Field Ops
Envision a mid-level analyst at Shell preparing for a sustainability audit. Slide 5's editable diagram breaks down carbon footprints across extraction phases, allowing quick swaps for regional variances. The result? A compelling case for green tech investments that secured funding in similar scenarios.
In training sessions, use the template's comparison slides to contrast conventional vs. renewable integrations, fostering discussions on hybrid models. For client pitches, the world map becomes your hero: Animate oil flows from Middle East to U.S. refineries, quantifying economic impacts with embedded stats.
- Assess Your Dataset: Compile KPIs like reserves or throughput.
- Map and Customize: Drop data into placeholders, adjust scales for accuracy.
- Layer Insights: Add annotations for forecasts, like IEA projections.
- Deliver Dynamically: Use build animations to unveil trends step-by-step.
These workflows mirror practices from energy consultancies, where visuals aren't optional - they're operational imperatives.
Pro Tips to Amplify Your Energy Story
For extra punch, sync with Excel for live data pulls, turning static slides into dashboards. Or, apply subtle gradients to denote risk levels, a tactic borrowed from risk management frameworks like those in API standards. In one BP-inspired overhaul, such tweaks clarified volatility models, averting miscommunications worth thousands.
Beyond Basics: Why This Template Powers Ahead
Generic energy templates often overlook sector nuances, like volumetric units or regulatory overlays. Ours? It's laser-focused, with LSI-friendly terms woven in for better search visibility, but more importantly, for intuitive navigation. Export to PDF for handouts or Keynote for Mac users, ensuring versatility across your pipeline.
Invest in clarity that converts - secure your Oil Industry PowerPoint Diagram Template now and energize your next briefing with visuals that extract value from every slide.
Frequently Asked Questions
Q: Is the world map fully interactive?A: Yes, with clickable regions and animation support for highlighting key areas like production hubs.
Q: Can I adapt this for renewable energy talks?A: Definitely - recolor for solar/wind and repurpose diagrams for transition impacts.
Q: What's the slide count and format?A: 11 editable slides in .PPTX, compatible with PowerPoint 2016+ and Google Slides.
Q: Does it support data imports?A: Easily link to Excel for real-time updates on metrics like barrel prices.
Q: Are industry-specific icons included?A: Over 20, from derricks to valves, all vector-based for sharp scaling.
Q: How about mobile compatibility?A: Optimized for seamless viewing and editing on tablets during site visits.