Sales And Distribution PowerPoint Diagrams: Chart Your Path to Revenue


Type: PowerPoint Diagrams template
Category: Organizational, 3D, Silhouettes & People
Sources Available: .pptx
Product ID: PD00168
Template incl.: 13 editable slides
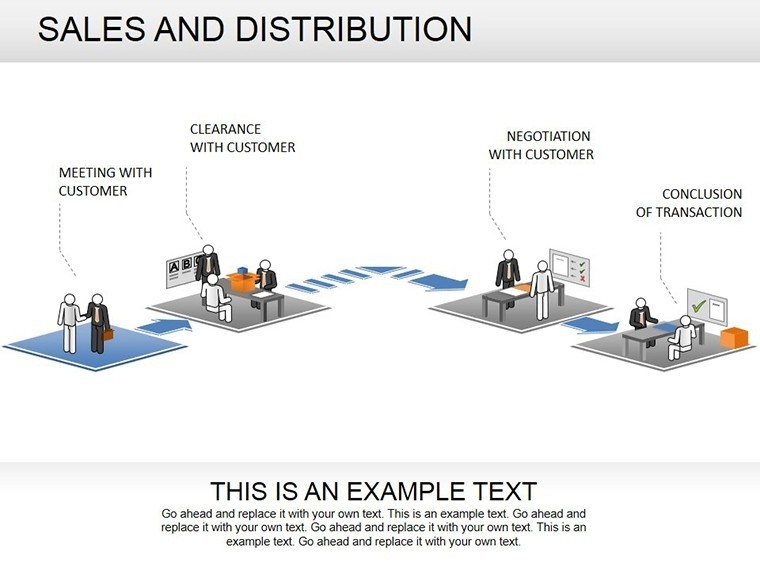
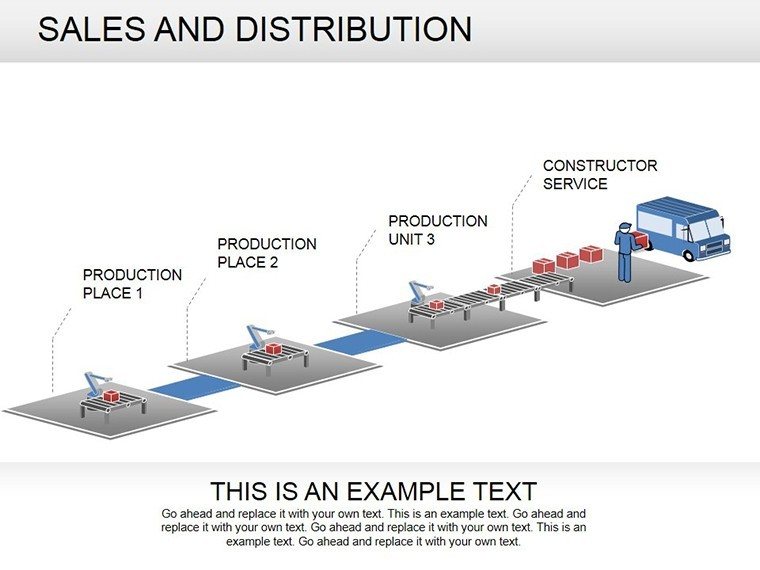
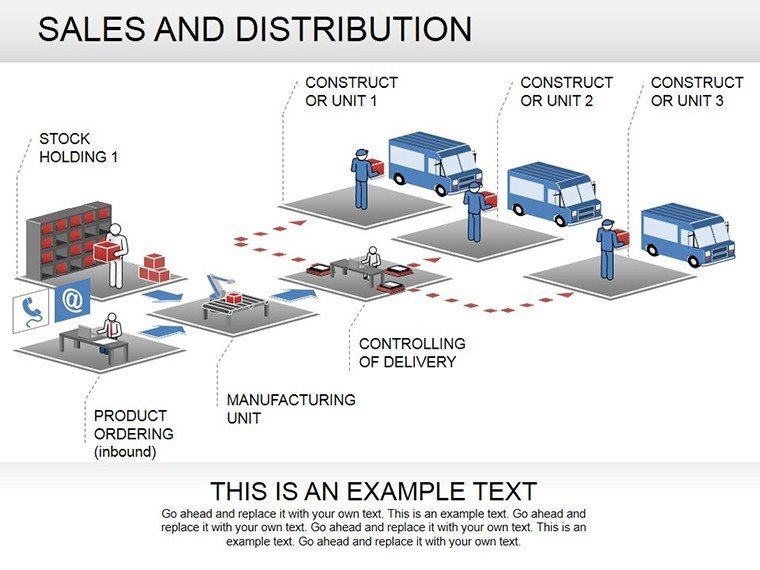
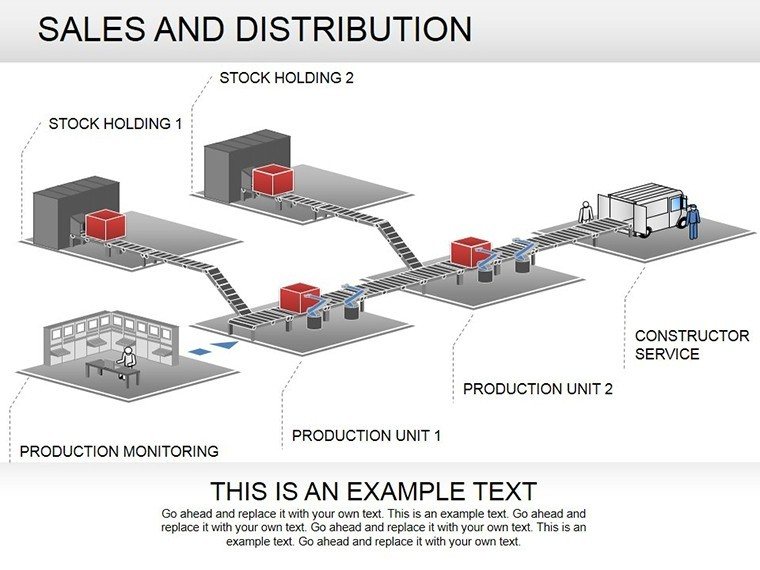
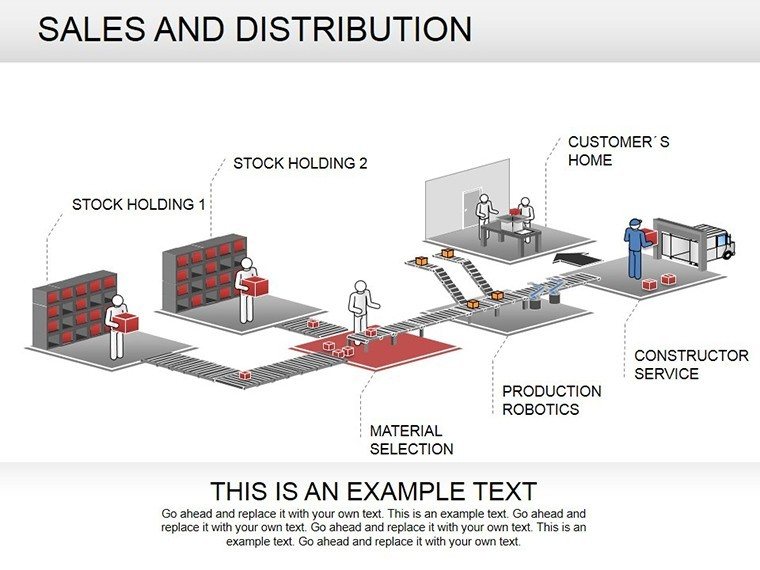
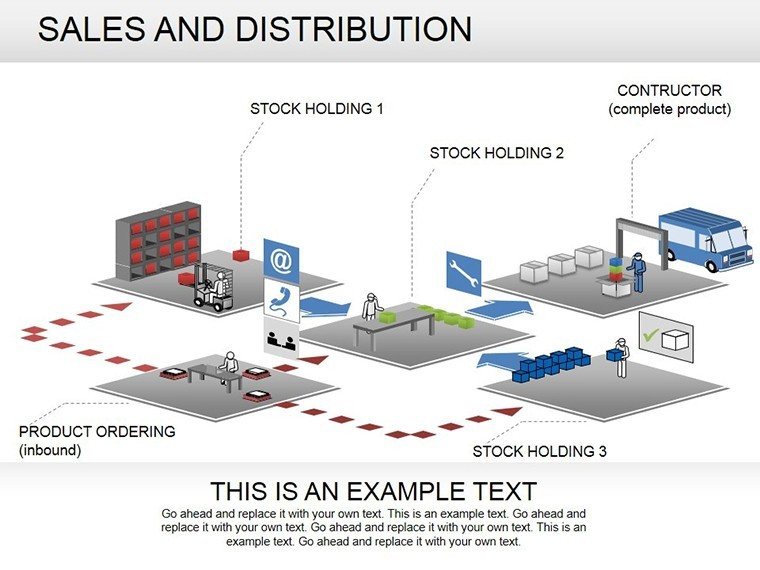
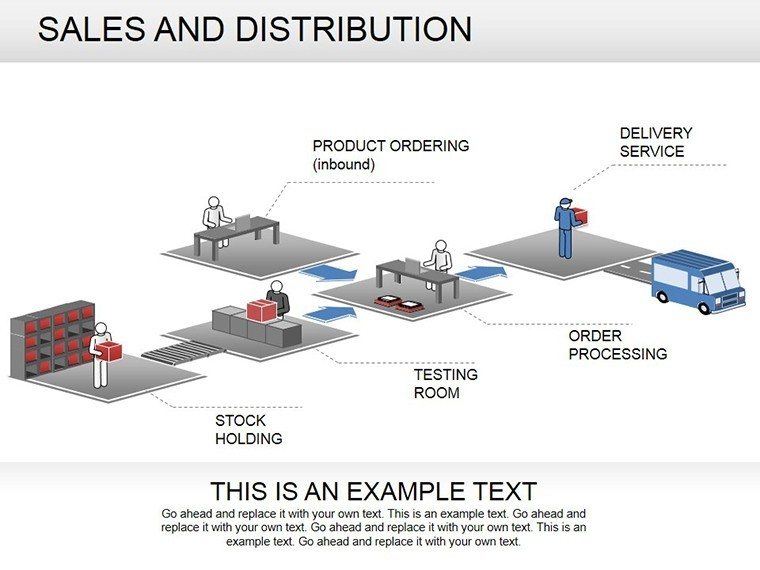
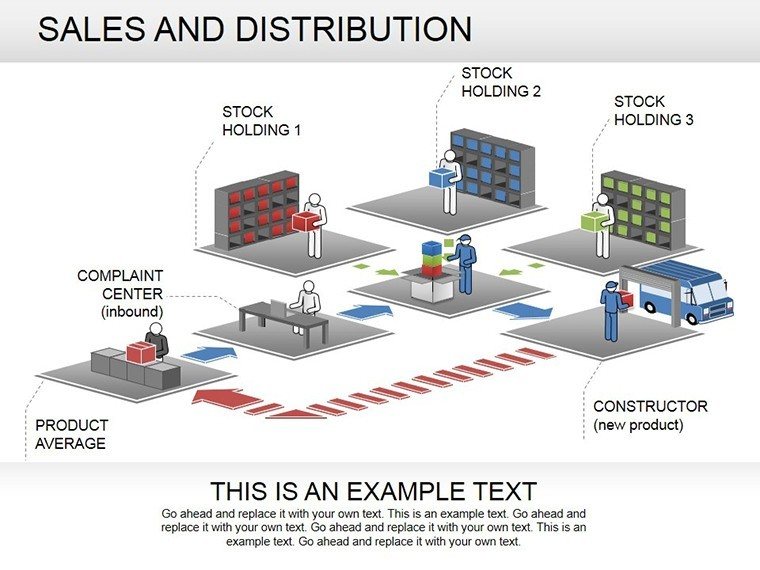
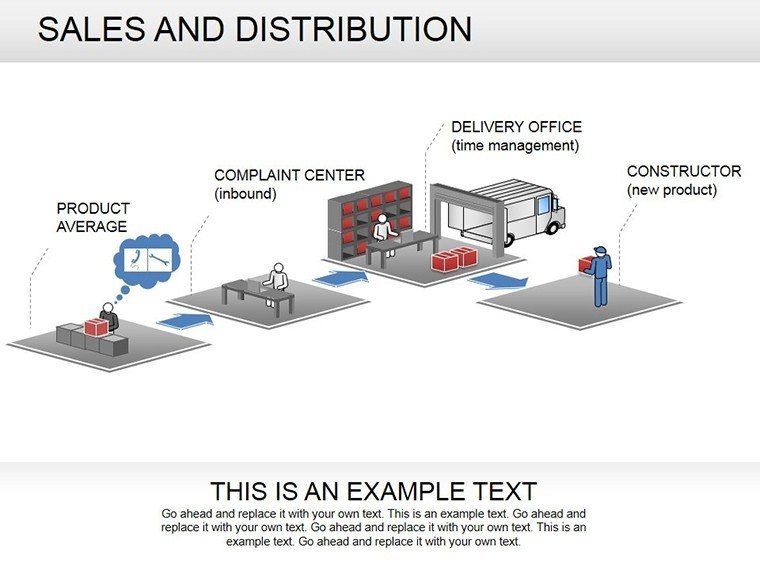
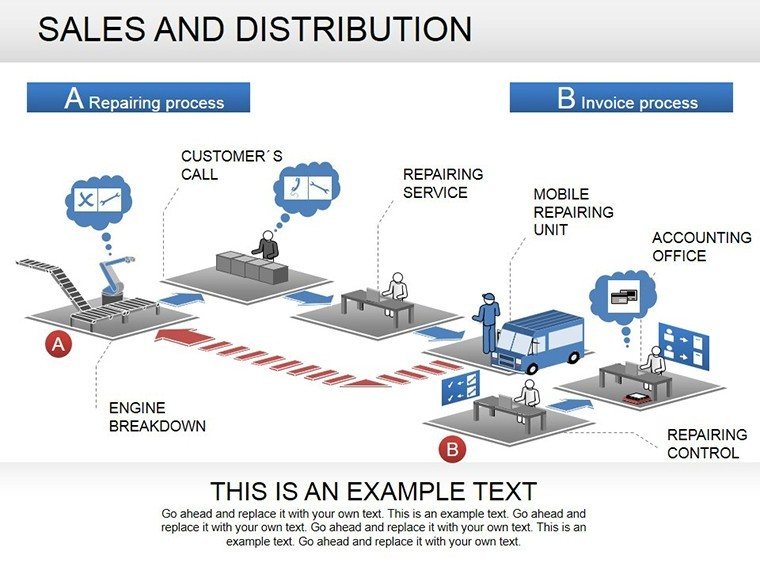
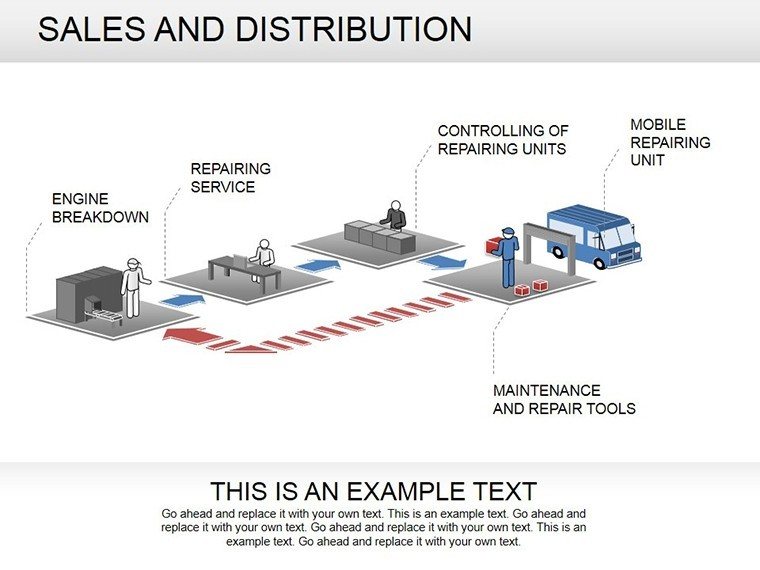
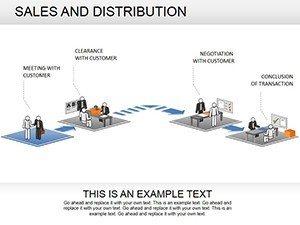
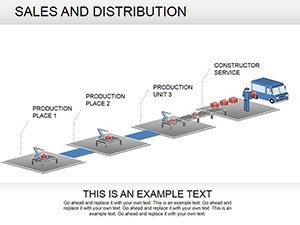
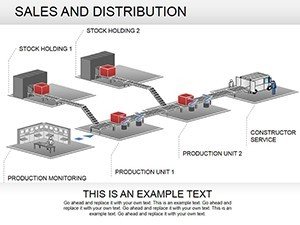
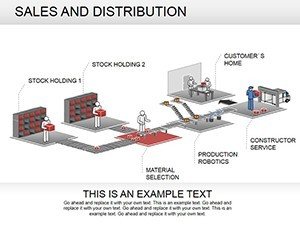
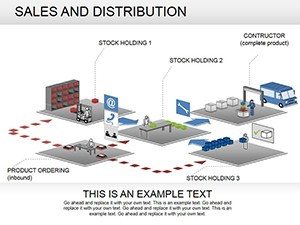
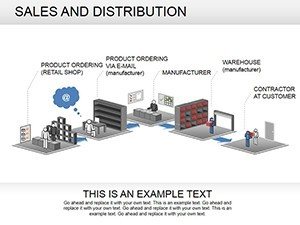
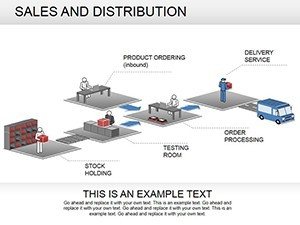
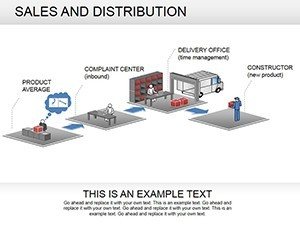
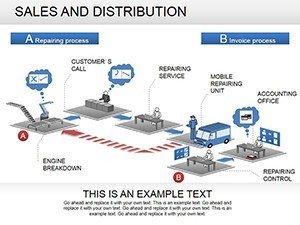
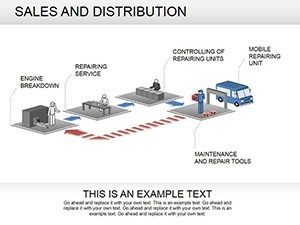
Sales isn't a straight line - it's a web of channels, funnels, and feedback loops begging for visual mastery. Our Sales And Distribution PowerPoint Diagrams template, with 13 meticulously crafted slides, hands distributors, marketers, and sales leads the reins to illuminate every touchpoint. From funnel breakdowns to channel matrices, this pack turns raw numbers into narratives that close deals.
Tailored for the hustle of B2B pitches or e-commerce strategies, imagine deploying a 3D bar graph on Slide 8 to tower regional performances, instantly spotlighting underperformers. Drawing from CRM best practices like those in Salesforce playbooks, it's editable to weave in your KPIs, ensuring presentations that don't just inform but inspire action.
For a distribution coordinator at Procter & Gamble analogs, this meant visualizing supply tiers, optimizing routes that trimmed logistics by 15%. It's proof: Great diagrams don't sell products - they sell visions.
Unique Features Tailored for Sales Dynamos
What elevates this from stock to stellar? Intentional design for revenue warriors.
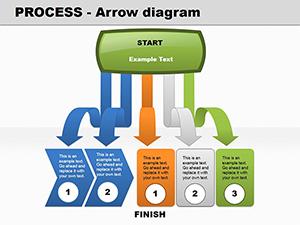
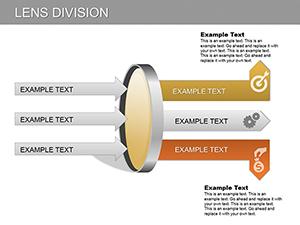
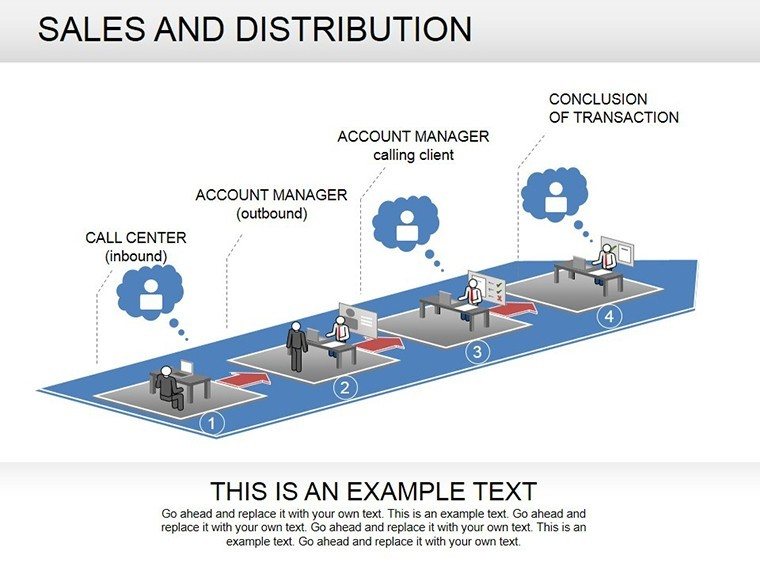
- Varied Graph Suite: Flowcharts for journeys, bars for comparisons, pies for shares, 3D for drama.
- Effortless Customization: Drag-drop elements, recolor palettes, text scalability.
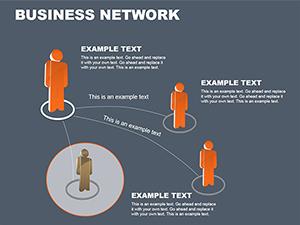
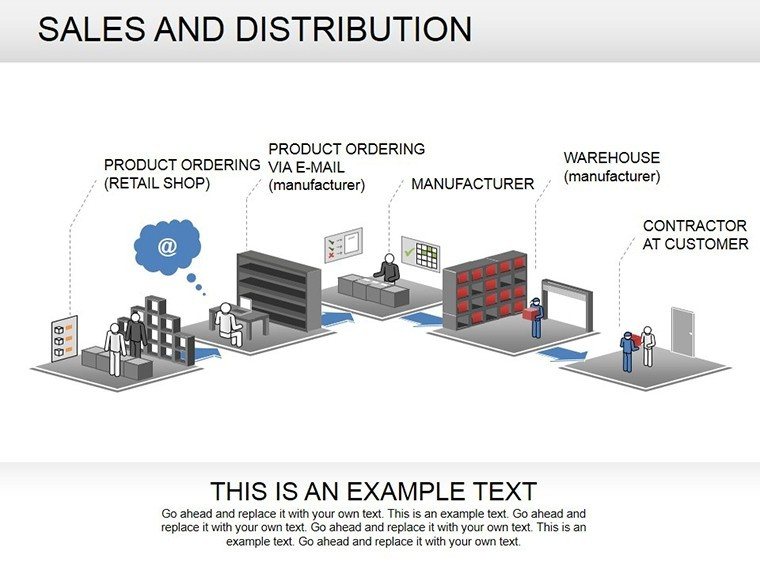
- People-Centric Icons: Silhouettes depicting roles, from reps to buyers, humanizing data.
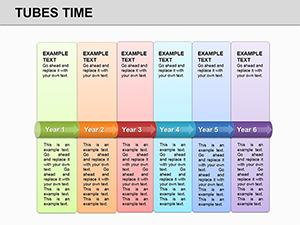
- Metric-Ready Layouts: Pre-formatted for funnel drops or conversion rates.
Versus DIY charts, which skew under pressure, these hold firm, enhancing credibility.
Strategic Use Cases Across Sales Cycles
In a quarterly review, harness the pie chart to slice market penetration, customizing wedges for geo-variances. For training, a flowchart maps objection handling, branching to success paths.
Client demos? 3D visuals stack distribution efficiencies, quantifying ROI with layered metrics.
- Align Objectives: Pinpoint metrics like CAC or CLV.
- Build Visuals: Select and infuse data.
- Enhance Engagement: Animate progressions.
- Close Strong: Tie to calls-to-action.
Echoing HubSpot tactics, these fuel funnel flywheels.
Savvy Tweaks for Peak Performance
Embed QR codes for interactive demos or gradient fills for trend signals. In a Nielsen-like audit, this clarified channel overlaps, boosting ad spends' efficacy.
Outpace Ordinary Templates
Basic ones lack sales flair; ours infuses motivation with vibrant, scalable assets. Multi-format exports keep you agile.
Propel your pipeline - snag the Sales And Distribution PowerPoint Diagrams today and distribute wins like never before.
Frequently Asked Questions
Q: What diagrams are featured?A: Flowcharts, bars, pies, 3D, silhouettes for comprehensive coverage.
Q: Ideal for e-commerce?A: Yes, perfect for channel and fulfillment visuals.
Q: Edit ease?A: Drag-drop, no design degree needed.
Q: Slide details?A: 13 in .PPTX, versatile compatibility.
Q: Performance tracking?A: Built for metrics integration.
Q: Team collaboration?A: Google Slides sync for shared edits.